Key Findings:
- The United States has the highest statutory corporate tax rate in the industrialized world at 35 percent (39.1 percent when including the average state corporate tax rate). However, our research concludes that each new dollar in corporate investment is actually taxed at a rate of 56.3 percent.
- This report estimates the marginal effective tax rate (METR) for eight types of business investment. This includes additional taxes—such as property taxes and state and local business income taxes—that businesses must account for when they decide if a new plant or piece of equipment will be profitable. It also includes taxes paid by shareholders while subtracting for depreciationDepreciation is a measurement of the “useful life” of a business asset, such as machinery or a factory, to determine the multiyear period over which the cost of that asset can be deducted from taxable income. Instead of allowing businesses to deduct the cost of investments immediately (i.e., full expensing), depreciation requires deductions to be taken over time, reducing their value and disco allowances and pertinent tax credits.
- While federal taxes weigh significantly on the cost of capital, state and local taxes—especially property taxes—comprise roughly one-third of the total tax on new capital investment, according to the report.
- Under this methodology, the proposed 20 percent corporate rate under consideration in tax reform negotiations would lower the METR on corporate investment to 50.1 percent, a 10.9 percent decrease.
- Alternative assumptions on the tax status of marginal investors are presented in the Appendix.
The literature on measuring the impact of tax policy on altering new business investment behavior is based on the concept of the user cost of capital developed by Dale Jorgenson (1963) and Robert Hall and Dale Jorgenson (1967). Changes in taxation, including but not limited to changes in the statutory corporate tax and personal income tax, would change the user cost of capital and thereby impact investment decisions at the margin. Marginal effective tax rates are commonly used to measure this impact. This study will show how the Tax Foundation’s Taxes and Growth (TAG) model measures marginal tax rates on different types of capital investment.
The Measurement of the Service Price
The service price of capital is also sometimes referred to as the user cost of capital. It is the cost of employing or obtaining one unit of a capital asset over a defined period of time. The user cost of capital is the minimum rate of return that an investment must attain to cover all taxes, economic depreciation (loss of value over time due to wear and tear or obsolescence), and the opportunity cost or minimum required rate of return (Jorgenson, 1963). (“Service price” usually includes all costs, including economic depreciation. The term “user cost of capital” usually includes all costs other than economic depreciation.)
Corporate and noncorporate businesses, the two main business sectors specified in the TAG model, have different equations for their service prices, because the tax regimes vary by sector.[1]
To illustrate how the service price is calculated in the TAG model, we begin with a cash-flow statement of business receipts for noncorporate capital expressed as in equation (1). The gross after-tax return for all noncorporate capital can be expressed as tax-inclusive business income subtracting all taxes. Taxes under consideration in this study include federal business (corporate or noncorporate) income taxes, the federal gift and estate taxAn estate tax is imposed on the net value of an individual’s taxable estate, after any exclusions or credits, at the time of death. The tax is paid by the estate itself before assets are distributed to heirs., as well as all kinds of taxes at the state and local level, such as property taxes, business income taxes, and gift and estate taxes.
(1)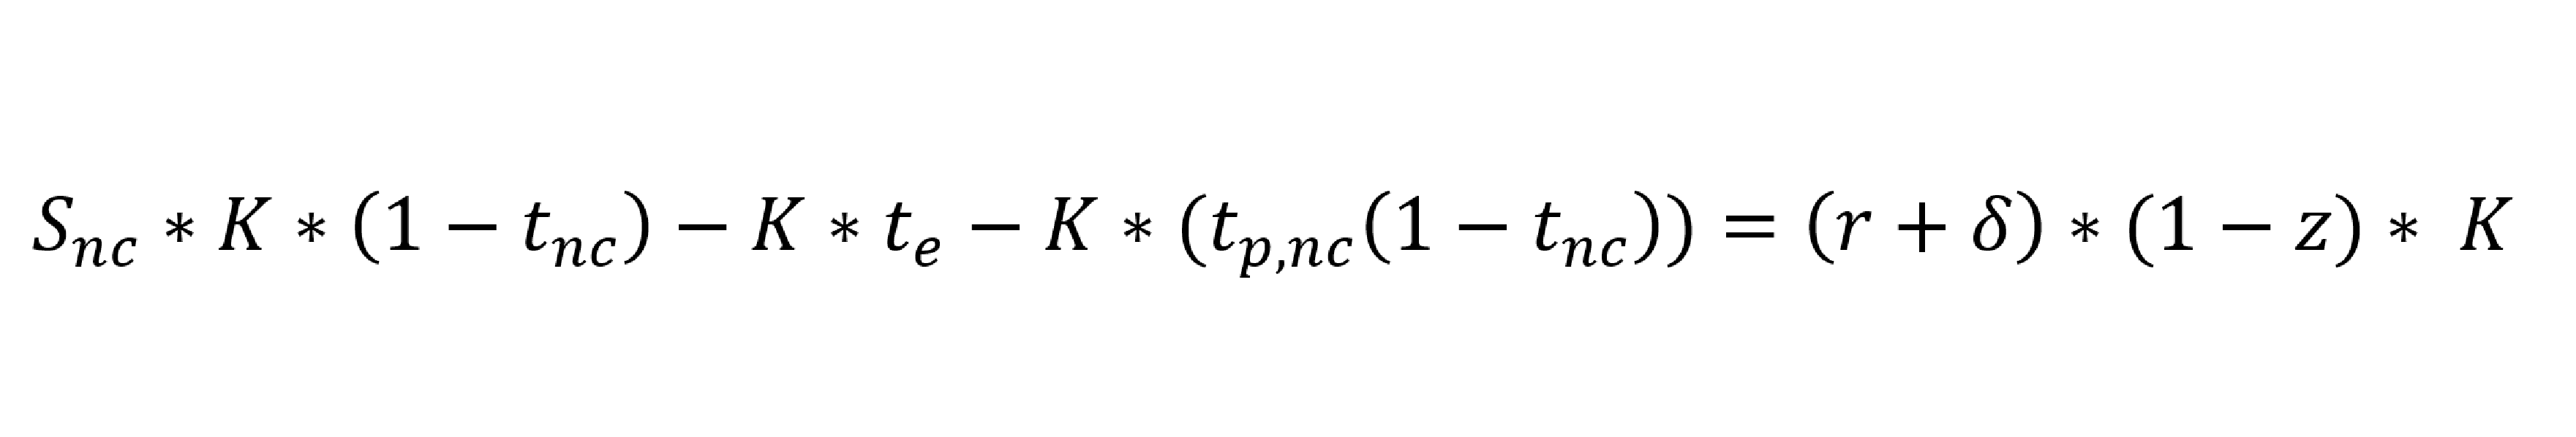
where Snc is the service price for noncorporate capital; K is the capital stock in the noncorporate sector; r is the real after-tax rate of return; te is the combined federal and state estate and gift tax rate; tp,nc is the property taxA property tax is primarily levied on immovable property like land and buildings, as well as on tangible personal property that is movable, like vehicles and equipment. Property taxes are the single largest source of state and local revenue in the U.S. and help fund schools, roads, police, and other services. on noncorporate capital assets at the state and local level; δ is the rate of economic depreciation; and z is the cost reduction from tax depreciation allowances and the investment credit (if any). That is, (1-z) is the remaining cost of the assets after tax deductions and credits.
The service price of noncorporate capital asset i can be formulated as equation (2) by dividing both sides of Equation (1) by K and applying the tax parameters relevant to asset i.
(2)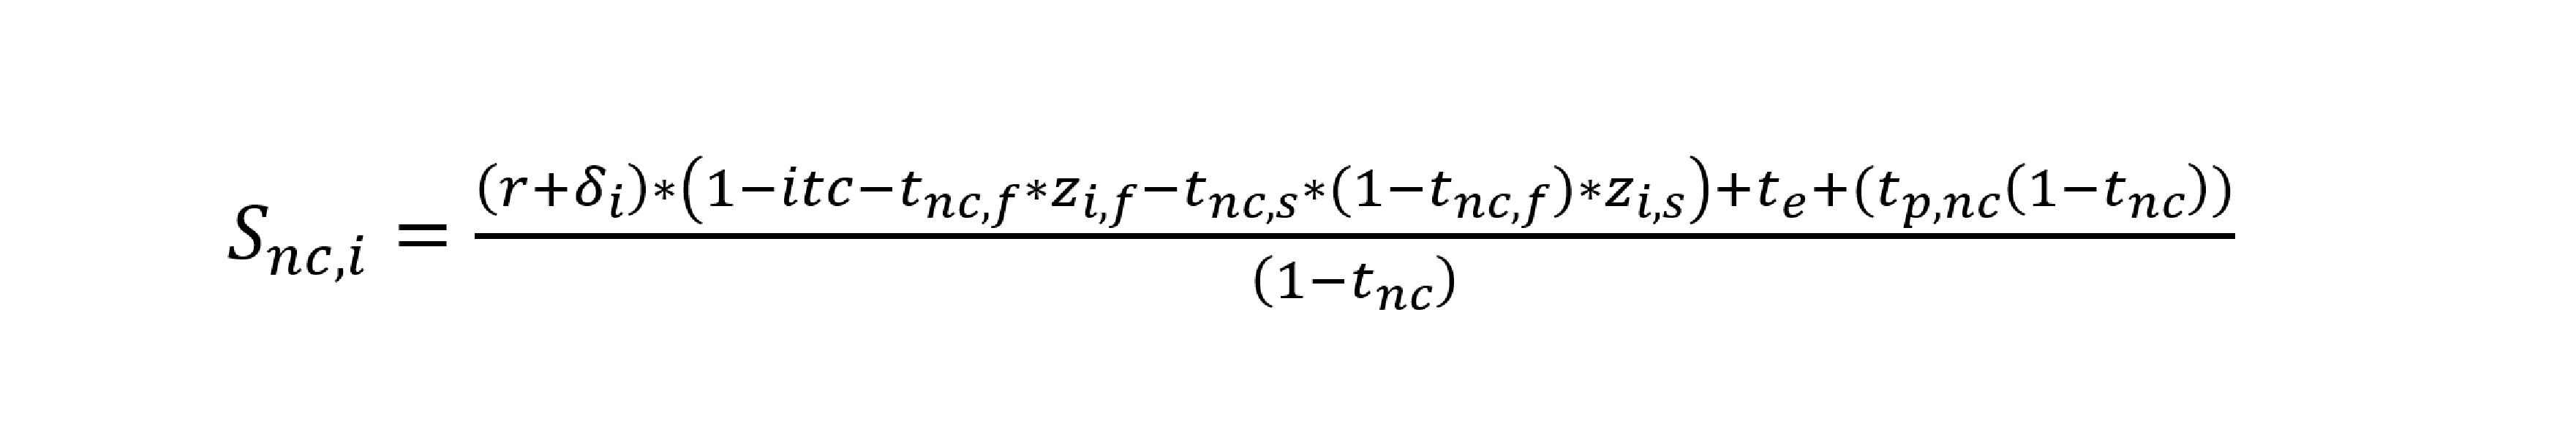
where i is an indicator for capital asset i; itc is the rate of any investment tax creditA tax credit is a provision that reduces a taxpayer’s final tax bill, dollar-for-dollar. A tax credit differs from deductions and exemptions, which reduce taxable income rather than the taxpayer’s tax bill directly. taken against all capital assets; tnc,f is the noncorporate income tax rate at the federal level; zi,f is the net present value of cost recovery for asset i at the federal level; and tnc,s and zi,s are the corresponding values for the state level. The term tnc is combined business income tax rate at the federal and state level and can be expressed as tnc = tnc,f + tnc,s – tnc,f * tnc,s.
Unlike the noncorporate sector, the corporate sector has a second layer of taxes: the shareholder tax on capital gains and dividends. Therefore, the rate of return for the corporate sector needs to be grossed up to cover the additional individual taxes.
Following the approach for the noncorporate sector, the service price of capital for corporate asset can be expressed as follows
(3)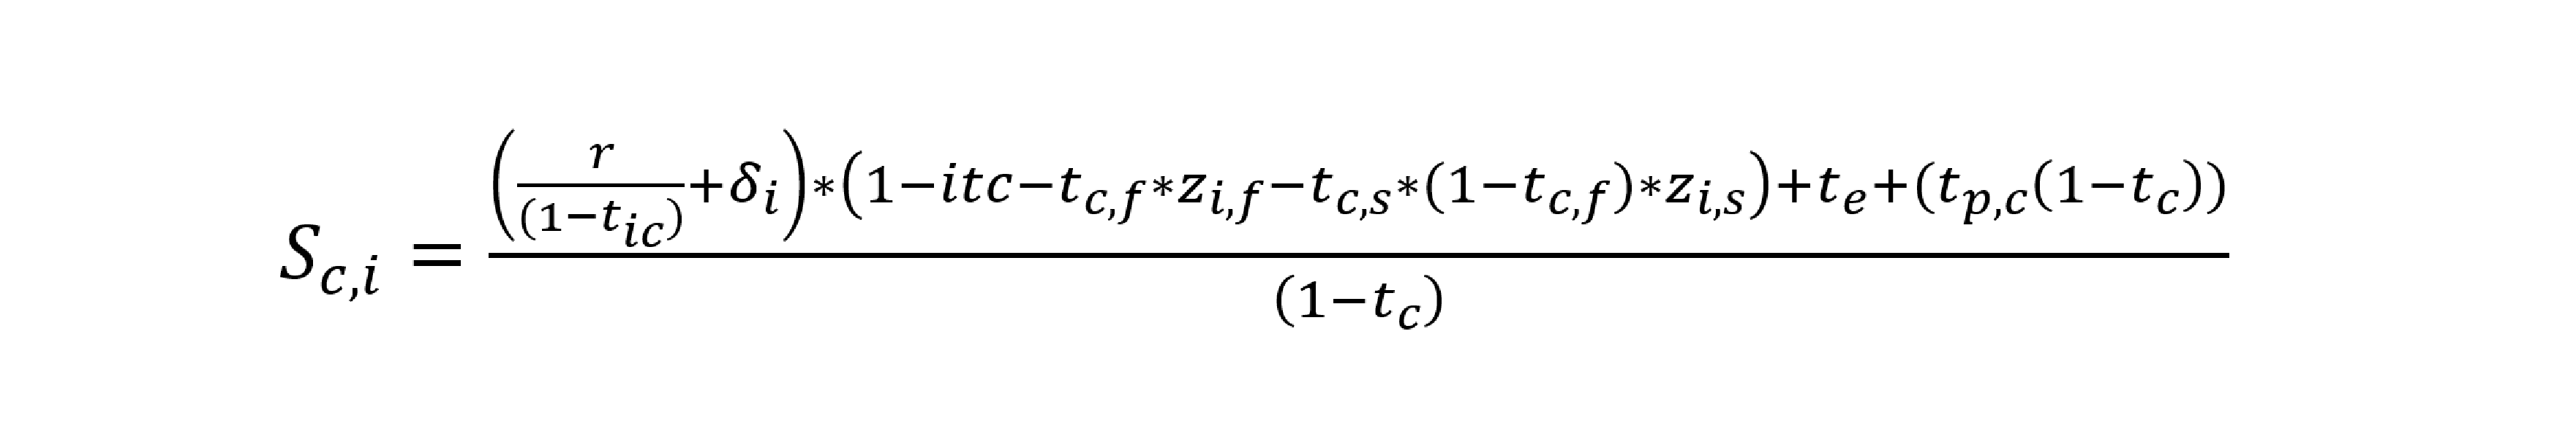
where tic is the combined federal and state personal income tax rate on corporate income; tp,c is the property tax on corporate capital assets at the state and local level; tc,f is the corporate income tax rate at the federal level; zi,f is the net present value of cost recoveryCost recovery refers to how the tax system permits businesses to recover the cost of investments through depreciation or amortization. Depreciation and amortization deductions affect taxable income, effective tax rates, and investment decisions. for asset i at the federal level; tc,s and zi,s are the corresponding values for the state level. The term tc is the combined corporate income taxA corporate income tax (CIT) is levied by federal and state governments on business profits. Many companies are not subject to the CIT because they are taxed as pass-through businesses, with income reportable under the individual income tax. rate at the federal and state level and can be expressed as tc = tc,f + tc,s – tc,f * tc,s.
Weighted Average Marginal Tax Rates
The weighted average marginal tax rateThe marginal tax rate is the amount of additional tax paid for every additional dollar earned as income. The average tax rate is the total tax paid divided by total income earned. A 10 percent marginal tax rate means that 10 cents of every next dollar earned would be taken as tax. is a summary measure of the tax burden across all assets under the user cost of capital framework. It is the difference (tax wedge) between the real pretax and after-tax user costs observed in the real world, divided by the real pretax user cost. That is, the TAG model calculates the marginal tax rate as the difference between the real pretax user cost (= service price net of the economic depreciation rate) and the real after-tax rate of return, measured as a percent of the pretax user cost.
The weighted average marginal effective tax rate for noncorporate capital (METRnc) and corporate capital (METRc) can be expressed respectively as follows:
(4)
(5)
For example, if the minimum required service price to engage an investor is 20 percent, the economic depreciation is 5 percent, and if the post-tax rate of return on capital demanded by the investor is 5 percent, the marginal tax rate would be 66.7 percent. (That is: [(20 – 5) – 5]/(20 – 5) = 10/15 = .667.)
Effective Marginal Tax Rates by Asset Types and Business Form
Table 1 is the calculated marginal effective tax rate across different types of capital assets. It is worth noting that corporate capital assets face higher taxes than noncorporate capital assets. On a weighted average basis, new corporate investment faces a marginal effective rate of 56.3 percent, while noncorporate capital investment faces a marginal effective rate of only 38.1 percent. The large difference can be explained by the two layers of taxation levied on the corporate returns described earlier in this paper.
| Corporate | Noncorporate | |
|---|---|---|
| Source: Tax Foundation, Taxes and Growth Model, November 2017. | ||
| Equipment & software | 53.8% | 28.2% |
| Nonresidential structures | 57.6% | 34.4% |
| Intellectual property | 43.7% | 18.4% |
| Residential structures | 57.3% | 34.8% |
| Inventories | 60.9% | 41.7% |
| Commercial land | 60.9% | 41.7% |
| Nonfarm land | 60.9% | 41.7% |
| Farm land | 60.9% | 41.7% |
| Weighted average | 56.3% | 38.1% |
Based on the “Big Six” Tax Framework released by Republican leadership, and the recently-passed House and Senate tax bills,[2] the federal corporate income tax rate would be lowered from 35 to 20 percent. The TAG model shows that a 20 percent corporate tax rate would reduce the marginal effective tax rates for most capital assets by 10.9 percent (see Table 2). (That is 10.9 percent of the tax, not 10.9 percentage points. For example, the weighted average corporate tax rate would fall from 56.3 percent to 50.1 percent, a 6.2 percentage point drop in the 56.3 percent tax, equal to a 10.9 percent reduction in the tax.)
| Source: Tax Foundation, Taxes and Growth Model, November 2017. | |||
| Current law corporate | 20% corporate rate | (% change) | |
|---|---|---|---|
| Equipment & software | 53.8% | 48.4% | -10.1% |
| Nonresidential structures | 57.6% | 50.9% | -11.6% |
| Intellectual Property | 43.7% | 42.5% | -2.8% |
| Residential structures | 57.3% | 50.7% | -11.5% |
| Inventories | 60.9% | 53.2% | -12.5% |
| Commercial land | 60.9% | 53.2% | -12.5% |
| Nonfarm land | 60.9% | 53.2% | -12.5% |
| Farm land | 60.9% | 53.2% | -12.5% |
| Weighted average | 56.3% | 50.1% | -10.9% |
Apart from reducing the statutory rate on corporate income, speeding up cost recovery for capital investments to encourage businesses to invest more is another well-researched component of fundamental business tax reform. Compared to current law, full expensing of all capital investment (an immediate write-off instead of depreciation for equipment and structures) would reduce the weighted average marginal effective tax rate for corporate assets by 15.4 percent, and reduce weighted average METR for capital assets in the noncorporate sector by 14.6 percent (see Table 3). These results are based on current law and not on the previously modeled 20 percent corporate income tax rate.
| Source: Tax Foundation, Taxes and Growth Model, November 2017. | ||||||
| Corporate | Noncorporate | |||||
|---|---|---|---|---|---|---|
| Current law | Full expensing | (% change) | Current law | Full expensing | (% change) | |
| Equipment & software | 53.8% | 43.3% | -19.6% | 28.2% | 18.0% | -36.2% |
| Nonresidential structures | 57.6% | 43.9% | -23.8% | 34.4% | 19.2% | -44.2% |
| Intellectual property | 43.7% | 42.1% | -3.6% | 18.4% | 16.4% | -11.2% |
| Residential structures | 57.3% | 43.8% | -23.5% | 34.8% | 19.3% | -44.5% |
| Inventories | 60.9% | 60.9% | 0.0% | 41.7% | 41.7% | 0.0% |
| Commercial land | 60.9% | 60.9% | 0.0% | 41.7% | 41.7% | 0.0% |
| Nonfarm land | 60.9% | 60.9% | 0.0% | 41.7% | 41.7% | 0.0% |
| Farm land | 60.9% | 60.9% | 0.0% | 41.7% | 41.7% | 0.0% |
| Weighted average | 56.3% | 47.6% | -15.4% | 38.1% | 32.6% | -14.6% |
The marginal tax results are impacted by different business tax provisions, both at the federal level and at the state and local level. To focus on the role of federal tax policies only, we recalculate these METRs by zeroing out all state and local taxes impacting service prices, while fixing the rate of return for capital investments.
Table 4 shows the METRs due to federal taxes only. On a weighted average basis, the numbers are 42.7 and 26.7 percent for corporate and noncorporate sectors respectively, or around 24 percent lower than the combined federal, state, and local baseline level, which indicates that ignoring state and local taxes in calculating METRs would distort the picture considerably.
| Source: Tax Foundation, Taxes and Growth Model, November 2017. | ||||||
| Corporate | Noncorporate | |||||
|---|---|---|---|---|---|---|
| Current law | No state and local taxes | (% change) | Current law | No state and local taxes | (% change) | |
| Equipment & software | 53.8% | 39.8% | -26.1% | 28.2% | 15.6% | -44.5% |
| Nonresidential structures | 57.6% | 44.6% | -22.5% | 34.4% | 22.6% | -34.4% |
| Intellectual property | 43.7% | 24.9% | -43.1% | 18.4% | 5.0% | -72.9% |
| Residential structures | 57.3% | 44.2% | -22.8% | 34.8% | 23.0% | -34.0% |
| Inventories | 60.9% | 48.7% | -20.0% | 41.7% | 30.8% | -26.3% |
| Commercial land | 60.9% | 48.7% | -20.0% | 41.7% | 30.8% | -26.3% |
| Nonfarm land | 60.9% | 48.7% | -20.0% | 41.7% | 30.8% | -26.3% |
| Farm land | 60.9% | 48.7% | -20.0% | 41.7% | 30.8% | -26.3% |
| Weighted Average | 56.3% | 42.7% | -24.1% | 38.1% | 26.7% | -29.9% |
Conclusion
This study demonstrates how the Tax Foundation’s TAG model calculates the weighted average METRs for different capital assets in the corporate and noncorporate sectors. The high marginal rates of up to 56.3 percent in the corporate sector illustrate why there is an urgent need for business tax reform. A shift to a 20 percent corporate tax rate would generate reduction in the marginal effective federal tax rate to 50.1 percent (a 10.9 percent reduction). A shift to full expensingFull expensing allows businesses to immediately deduct the full cost of certain investments in new or improved technology, equipment, or buildings. It alleviates a bias in the tax code and incentivizes companies to invest more, which, in the long run, raises worker productivity, boosts wages, and creates more jobs. would generate reduction in the marginal effective federal tax rate to 47.6 percent (a 15.4 percent reduction). These changes in the marginal effective tax rate would induce a significant expansion of the capital stock. They are the rates that affect the investment decisions of the taxable marginal lenders. Their decisions determine the amount of capital assets which are put to work inside the country, affecting productivity, wages, and employment.
Appendix
The concept of “at the margin” used in the body of this paper is that of the marginal return required on additional capital assets by the marginal lender, assumed to be a taxable saver/investor. Some analysts prefer to assume that nontaxable investors, or investors with the ability to defer taxes, share, at the margin, in expanding of capital investment. Others look at effective average tax rates, with no marginal elements involved. Here, we calculate effective marginal tax rates of the first of these alternatives.
Data from the Federal Reserve suggests that foreigners own around 25 percent of total assets in the United States. Returns on this portion of domestic capital assets can be taxed differently than returns on domestically-owned assets, depending on tax treaties. Also, over the last five years, tax-advantaged pension entitlements have accounted for nearly 30 percent of total financial assets of households. Tax-advantaged pension funds are tax-deferred or yield-exempted. For tax-deferred plans, changes in tax law have less effect on marginal tax rates than for currently taxable savers and lenders. The treatment of these assets may reduce effective marginal tax rates on new investment, if they can fund additions to private sector capital in proportion to their current holdings. However, many foreign lenders acquire government securities rather than real capital, including foreign central banks that add U.S. securities primarily for reserves and controlling currency moves. Endowments of tax-exempt institutions are unlikely to be marginal lenders, as they can only spend what their donors choose to contribute. Individuals are limited in the amounts they may contribute to tax-deferred retirement plans; those assets are eventually distributed and are then subject to the tax changes in question. In Table 5, we have calculated a marginal tax rate assuming that only 45 percent of investment income is taxable.
| Corporate | Noncorporate | ||||
|---|---|---|---|---|---|
| Current law | 20% corporate rate | Full expensing | Current law | Full expensing | |
| Source: Tax Foundation, Taxes and Growth Model, November 2017. | |||||
| Equipment & software | 48.0% | 41.8% | 36.1% | 28.2% | 18.0% |
| Nonresidential structures | 52.2% | 44.6% | 36.7% | 34.4% | 19.2% |
| Intellectual property | 36.5% | 35.1% | 34.8% | 18.4% | 16.4% |
| Residential structures | 51.8% | 44.4% | 36.7% | 34.8% | 19.3% |
| Inventories | 55.9% | 47.3% | 55.9% | 41.7% | 41.7% |
| Commercial land | 55.9% | 47.3% | 55.9% | 41.7% | 41.7% |
| Nonfarm land | 55.9% | 47.3% | 55.9% | 41.7% | 41.7% |
| Farm land | 55.9% | 47.3% | 55.9% | 41.7% | 41.7% |
| Weighted average | 50.7% | 43.8% | 40.9% | 38.1% | 32.6% |
Allowing a marginal effect of tax-exempt lenders reduces the effective marginal tax rate from 56.3 percent to 50.7 percent, a 10 percent reduction in the rate (5.6 percentage points). The corresponding METR for a 20 percent corporate tax rate is 43.8 percent, a 12.6 percent reduction from 50.7 percent; METR for full expensing is 40.9 percent, a 14.1 percent reduction. Using this definition, reductions in the tax moving from current law to a 20 percent corporate tax rate or full expensing would be about 20 percent smaller than under the definition in the main body, but would still induce large increases in capital formation.
[1] Data for the corporate sector in the TAG model includes both C corporations and S corporations. We utilize capital stock data from the U.S. Bureau of Economic Analysis, which does not report separate S corporationAn S corporation is a business entity which elects to pass business income and losses through to its shareholders. The shareholders are then responsible for paying individual income taxes on this income. Unlike subchapter C corporations, an S corporation (S corp) is not subject to the corporate income tax (CIT). and C corporation capital stocks.
[2] As this is being written, the tax bills are being negotiated in a House-Senate conference.
Share this article