


Tax Burden on Labor in Europe, 2024
4 min readBy:Governments with higher taxes generally tout that they provide more services, and while this is often true, the cost of these services can be more than half of an average worker’s salary, and for most, at least a third of their salary.
Individual income taxes, payroll taxes, and consumption taxes make up a large portion of many countries’ taxA tax is a mandatory payment or charge collected by local, state, and national governments from individuals or businesses to cover the costs of general government services, goods, and activities. revenue. These taxes combined make up the tax burden on labor both by taxing wages directly and by taxing wages used for consumption. This so-called tax burden on labor reflects the difference between an employer’s total cost of an employee and the employee’s net disposable income.
Payroll taxes are typically flat-rate taxes levied on wages, in addition to the taxes on income. In most Organisation for Economic Co-operation and Development (OECD) countries, both the employer and the employee pay payroll taxes. These taxes usually fund specific social programs, such as unemployment insurance, health insurance, and old age insurance. Although payroll taxes are typically split between workers and their employers, economists generally agree that both sides of the payroll taxA payroll tax is a tax paid on the wages and salaries of employees to finance social insurance programs like Social Security, Medicare, and unemployment insurance. Payroll taxes are social insurance taxes that comprise 24.8 percent of combined federal, state, and local government revenue, the second largest source of that combined tax revenue. ultimately fall on workers.
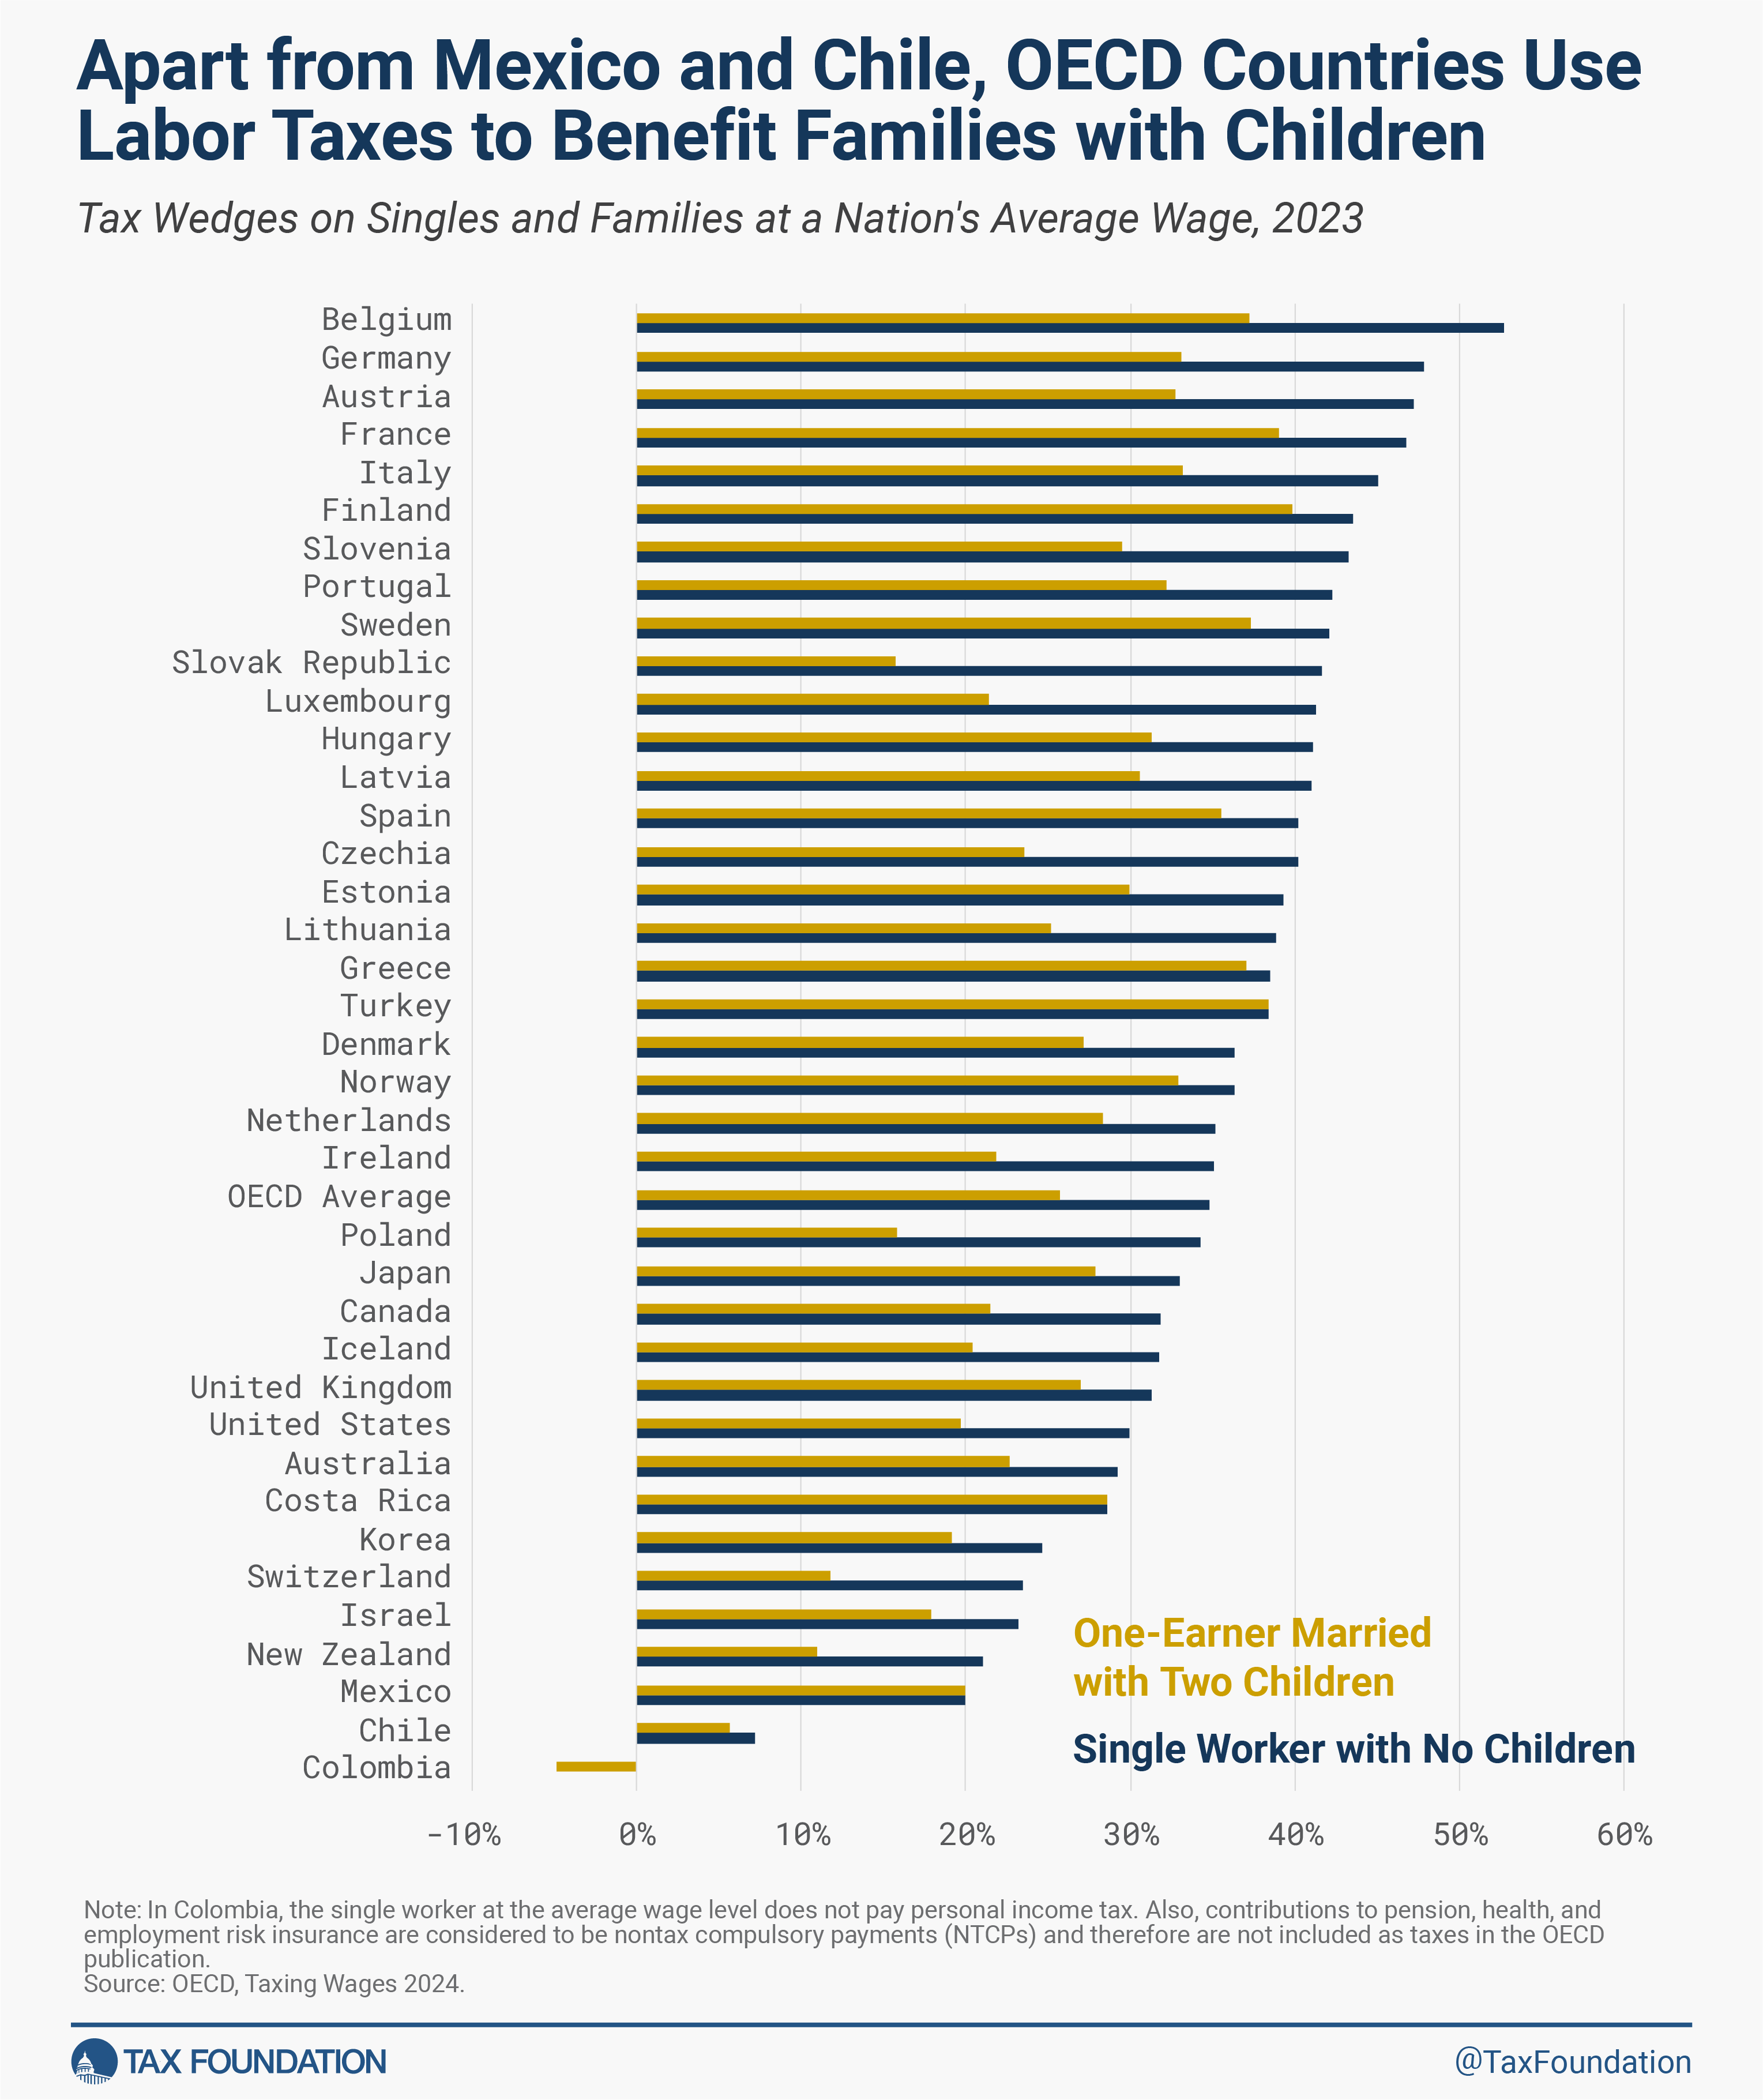
In 2023, single, average-wage workers paid about one-third of their wages in taxes. In most OECD countries, families had smaller tax burdens than single workers without children earning the same income.
Changes to Income Tax Systems Directly Impact the Tax Burden on Labor
Some individual countries have made substantial changes to their income and payroll taxes in the last two decades. Hungary, the OECD country with one of the highest tax burdens on labor in 2000 at 54.7 percent, has had the most notable decrease in its tax wedgeA tax wedge is the difference between total labor costs to the employer and the corresponding net take-home pay of the employee. It is also an economic term that refers to the economic inefficiency resulting from taxes. , to 41.2 percent in 2023. This is partially due to the introduction of a flat taxAn income tax is referred to as a “flat tax” when all taxable income is subject to the same tax rate, regardless of income level or assets. on income, which lowered the income tax burden relative to total labor costs. Additionally, Hungary reduced its payroll taxes relative to total labor costs. Lithuania and Sweden have also lowered their tax burdens on labor substantially, with a reduction between 6.8 and 8 percentage points each.
In Europe, the average tax burden on labor increased by 0.13 percentage points between 2022 and 2023. During this period, the tax burden increased the most in Luxembourg and Spain by 1.39 percentage points and 0.62 percentage points, respectively. Of the 17 European countries, 12 saw a decrease in real wages before tax. And in 17 countries, the average worker had a lower real post-tax income in 2023 than in 2022. Currently, 12 countries in Europe do not adjust the income tax to inflationInflation is when the general price of goods and services increases across the economy, reducing the purchasing power of a currency and the value of certain assets. The same paycheck covers less goods, services, and bills. It is sometimes referred to as a “hidden tax,” as it leaves taxpayers less well-off due to higher costs and “bracket creep,” while increasing the government’s spending power. . This slight increase in the tax burden and decrease in post-tax income shows the importance of indexing the income tax to inflation to avoid bracket creepBracket creep occurs when inflation pushes taxpayers into higher income tax brackets or reduces the value of credits, deductions, and exemptions. Bracket creep results in an increase in income taxes without an increase in real income. Many tax provisions—both at the federal and state level—are adjusted for inflation. .
Tax Wedges Vary across Europe
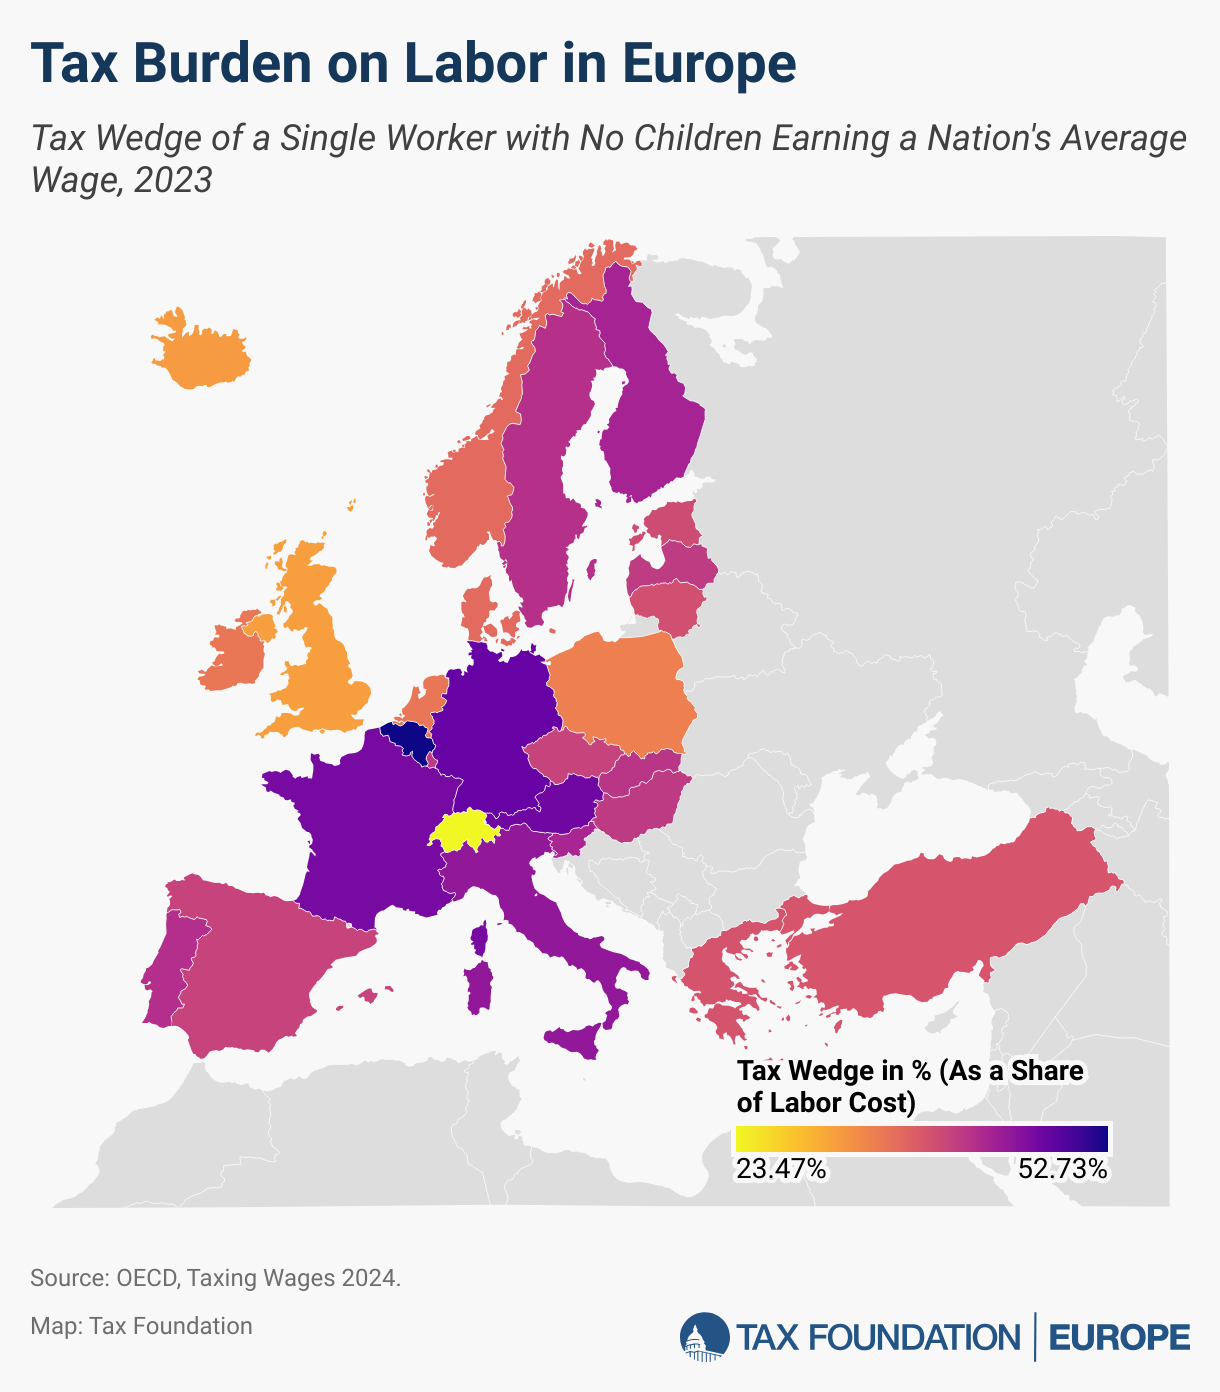
Although the tax wedge in Europe is generally high, there is a relatively wide range. The following map illustrates how European countries differ in their tax burdens on labor.
Belgium has the highest tax burden on labor at 52.7 percent (also the highest of all OECD countries), followed by Germany and Austria at 47.9 percent and 47.2 percent, respectively. Meanwhile, Switzerland had the lowest tax burden at 23.5 percent.
It’s important to note that European countries provide some targeted tax relief for families with children, typically through lower income taxes. In Belgium, a single worker earning the nation’s average wage faces a tax wedge of 52.7 percent. However, a family with two children and one adult earner would face a tax burden of 37.3 percent. Slovakia and Luxembourg have the largest disparity between the tax wedge for single workers and the tax wedge for families—a difference of over 20 percentage points. Turkey is the only country in Europe that does not tax families at a lower rate than single workers (at the average wage). Other OECD countries like Chile, Costa Rica, and Mexico do not tax families at a lower rate than single workers either.
To make the taxation of labor more efficient, policymakers should understand their country’s tax wedge and how their tax burden funds government services. This will be particularly important as policymakers explore ways to encourage a robust economic recovery.
Tax Burden on Labor in Europe
Tax Wedge of a Single Worker with No Children Earning a Nation's Average Wage, 2023
| Rank | Tax Wedge in % (As a Share of Labor Cost) |
|
|---|---|---|
| Belgium | 1 | 52.73% |
| Germany | 2 | 47.85% |
| Austria | 3 | 47.23% |
| France | 4 | 46.83% |
| Italy | 5 | 45.07% |
| Finland | 6 | 43.55% |
| Slovenia | 7 | 43.32% |
| Portugal | 8 | 42.26% |
| Sweden | 9 | 42.09% |
| Slovak Republic | 10 | 41.63% |
| Luxembourg | 11 | 41.33% |
| Hungary | 12 | 41.15% |
| Latvia | 13 | 41.06% |
| Spain | 14 | 40.23% |
| Czechia | 15 | 40.22% |
| Estonia | 16 | 39.35% |
| Lithuania | 17 | 38.91% |
| Greece | 18 | 38.48% |
| Turkey | 19 | 38.38% |
| Denmark | 20 | 36.38% |
| Norway | 21 | 36.37% |
| Netherlands | 21 | 35.14% |
| Ireland | 23 | 35.13% |
| Poland | 24 | 34.31% |
| Iceland | 25 | 31.72% |
| United Kingdom | 26 | 31.34% |
| Switzerland | 27 | 23.47% |
Stay informed on the tax policies impacting you.
Subscribe to get insights from our trusted experts delivered straight to your inbox.
SubscribePrevious Versions
-
Tax Burden on Labor in Europe, 2023
4 min read -
Tax Burden on Labor in Europe, 2022
4 min read -
Tax Burden on Labor in Europe, 2019
2 min read