Key Findings
- Government budget deficits absorb a portion of national or global saving, diverting the saving from supporting private investment. This is known as “crowding out.”
- However, saving is flexible both in magnitude and where it is invested. It can grow and move in response to higher borrowing needs and higher returns to saving and investment.
- Even relatively large budget deficits are dwarfed by huge levels of global saving.
- It takes very little change in interest rates to attract additional world saving to the United States.
- Consequently, government budget deficits have only a small effect on private investment. Crowding out per se is of minimal importance.
- The source of the deficits does matter. Deficits created by taxA tax is a mandatory payment or charge collected by local, state, and national governments from individuals or businesses to cover the costs of general government services, goods, and activities. relief do less damage to private investment than do deficits created by increases in government spending.
- The United States is an open economy, closely integrated with world capital markets. Some economic models wrongly treat the economy as largely closed to international capital flows, overstating the effect of deficits on economic growth, and understating the power of pro-investment, pro-saving tax reforms to boost investment, wages, and employment. Their predictions are off the mark, and hamper Congress’s work on tax reform.
Introduction
One of the major objectives of tax reform is to raise the level of economic activity, investment, productivity, wages, and employment. Lowering taxes on capital formation is widely assumed to be an essential step toward that goal. Skeptics contend that tax reductions fail to meet that objective because they raise the federal budget deficit and “crowd out” the saving needed to make additional investment possible. The “crowding out” argument is built into some of the models used by the Joint Committee on Taxation and others to project the impact of tax changes on the economy and the federal budget.
This paper evaluates the arguments for and against “crowding out” and compares these arguments to empirical studies. It discusses the impact of tax changes on the allocation of national income between consumption and saving, and the allocation of saving between private investment and government deficits. It finds that the crowding out argument is largely based on a mistaken assumption about the flexibility and availability of saving and credit for the financing of government deficits and private investment.
Government budget deficits do absorb a portion of national or global saving, diverting the saving from supporting private investment. This is known as “crowding out.” However, saving is flexible both in magnitude and where it is invested. It can grow as household income increases and move in response to higher borrowing needs and higher returns to investment. Much of a tax reduction feeds directly into saving, especially cuts in business taxation. Furthermore, the United States is an open economy closely integrated with world financial markets. Even relatively large budget deficits are dwarfed by huge levels of global saving. It takes only a minute change in interest rates to attract additional risk-averse world saving to the United States.
Consequently, government budget deficits have only a small effect on private investment. Private investment suffers from neither a lack of available savings nor onerous increases in the cost of borrowing. That said, the source of the deficits does matter. Deficits created by tax relief do less damage to private investment than do deficits created by increases in government spending.
Some forecasting models wrongly assert that saving is unresponsive to investment opportunities, and wrongly treat the economy as largely closed to international financial flows. Such models overstate the effect of deficits on economic growth, and understate the power of pro-investment, pro-saving tax reforms to boost investment, wages, and employment. Their predictions are off the mark, and hamper Congress’s work on tax reform.
How the Models Treat Deficits Can Affect the Prospects for Tax Reform
Economic models should not ignore deficits, but they should treat them properly. Changes in tax policy or government spending affect the economy and government revenues. When modeling the budget effects of tax or spending changes, the economic effects must be taken into account, because the economic changes will affect revenues and the resulting budget deficit. For the analysis to be complete, however, any effects on the economy of the changing budget deficit must be included in the calculations. If done right, including these effects can improve the accuracy of the budget estimates, which improves political decision-making. Overstating the effect, however, can make the modeling less accurate, and interfere with the adoption of optimal tax and spending policies.
For example, one of the key questions in the current tax reform debate is how much of a deficit increase to accept. Changes in government deficits and debt certainly affect government expenditures, particularly interest on the national debt. But does a change in the budget deficit also affect the amount of private investment or consumption, and alter the economic outcome of a fiscal policy change?
A reduction in taxes on capital formation can expand the economy by making investment more attractive. However, some economic models assume that an increase in the government budget deficit absorbs national saving and increases interest rates. Higher interest rates and less availability of saving to fund investment would block some of the expansion. This is the “crowding out” effect of deficits on investment.
A model that assumes a large crowding out effect from the deficit will forecast little economic growth from a tax cut, and little additional revenue from higher incomes. The deficit will rise and remain high. The models used by the Joint Committee on Taxation (JCT) are of this type.
Other models may assume that saving is flexible, and financial flows from abroad can supplement domestic saving to keep interest rates from rising and allow a significant rise in investment and incomes. The added revenues from the higher incomes would limit the rise in the deficit. The Tax Foundation Taxes and Growth Model is of this type.
In this paper, we discuss the three key channels through which government deficits affect national saving and the availability of investment financing: increased after-tax incomes, higher returns on saving, and international financial flows. Overall, the empirical evidence suggests these effects are large, and that the JCT assumption of rigid saving and adverse effects of crowding out on interest rates and investment is unreasonable. The accuracy of the JCT models could be improved by relaxing their strict assumption on the availability of national saving.
Saving out of Disposable Income
In general, macroeconomic models adhere to the national income identity. This stipulates that the amount of goods and services produced must equal private consumption, government consumption, and business investment. In this view of the world, increasing consumption, be it private or government, is only possible if goods and services that would have been used for investment are redirected to consumption. The extent to which the money borrowed by the government increases private or government consumption underlies the extent of the private-investment crowding out.
Many macroeconomic models assume that money borrowed by the government is used to fund government consumption. Government programs that purchase goods and services, such as military spending or federal employment, or state and local spending on schools or parks, completely crowd out private investment dollar-for-dollar. The increased consumption attracts resources away from capital formation and causes crowding out. However, when governments run deficits, a large part of the borrowed funds flow back into the private sector through tax relief or government transfers. The additional income to individuals in the private sector increases both consumption and saving.
A significant portion of government outlays and tax reduction goes directly into private saving, even before taking account of any changes in incentives to save or invest. The reflow from deficits into the credit markets through higher disposable incomes depends on the type of spending or tax reduction. If these flows of spending and payments are carefully traced through the national income and the national saving identities, one can see that tax relief and government transfers do not completely crowd out private investment. [1]
For example, business tax reduction immediately increases retained earnings, which are part of national saving, even before considering the effect of the tax reduction on the expected return on new investment, which should boost the business’s desire to add to capital formation. Personal tax relief and transfer payments raise disposable income. Some of the increase in disposable income is used for additional consumption, but some is saved or used to reduce debt (a form of saving).
Moreover, as businesses expand operations and increase their incomes, they can retain the additional earnings to fund future investment. Rather than distribute business earnings as income to individuals, a business can reinvest the earnings in another project. As they continue to reinvest earnings, more income is generated and more saving becomes available. This continues until the business exhausts all the profitable investment available, after which the business returns to distributing earnings to individuals. As such, economic growth creates additional saving for private investment.
In practice, who receives the benefit from the increased government spending will also affect crowding out. By design, transfers are allocated to households in the lower income brackets with the intent to increase their purchasing power. Households in the lower tax bracketsA tax bracket is the range of incomes taxed at given rates, which typically differ depending on filing status. In a progressive individual or corporate income tax system, rates rise as income increases. There are seven federal individual income tax brackets; the federal corporate income tax system is flat. tend to spend more of their income on consumption than saving. As a result, only a small portion of the transfers flows back into saving and the credit markets. Nonetheless, even government transfers, such as Social Security, SNAP, or unemployment insurance, do not completely crowd out private investment. Additional income increases the recipient’s ability to consume or save, which includes paying down debt. [3] On the other hand, increasing transfer payments lead to higher administrative costs, particularly when new rules expand the number of recipients. The additional cost of distributing the transfers effectively increases the amount consumed and reduces the amount saved. This exacerbates the crowding out.
Conversely, tax cuts only increase the income of households that pay taxes. Due to the progressivity of the U.S. tax code, most of the benefit from a tax cut goes to middle- and upper-income households. Higher-income households tend to save more of their income than lower-income households. Since a significant portion of the tax relief goes to households that tend to save, there is a greater reflow to the credit markets. Unlike transfer payments, lower taxes do not have an additional administration cost, since a reduction in the tax burden usually involves removing or reducing an existing tax. [4] Thus, using deficits to reduce taxes involves less crowding out than transfers or government spending.
In many cases, researchers have found that deficits do not curb the availability of saving for private investment, particularly when the borrowed money is used to provide tax relief for investment and saving. Thus, although the government is competing for the same pool of saving as private investment, not all money transferred to the private sector is consumed, the deficit is partly funded by additional private saving, and investment does not fall dollar for dollar of government borrowing.
Figure 1.
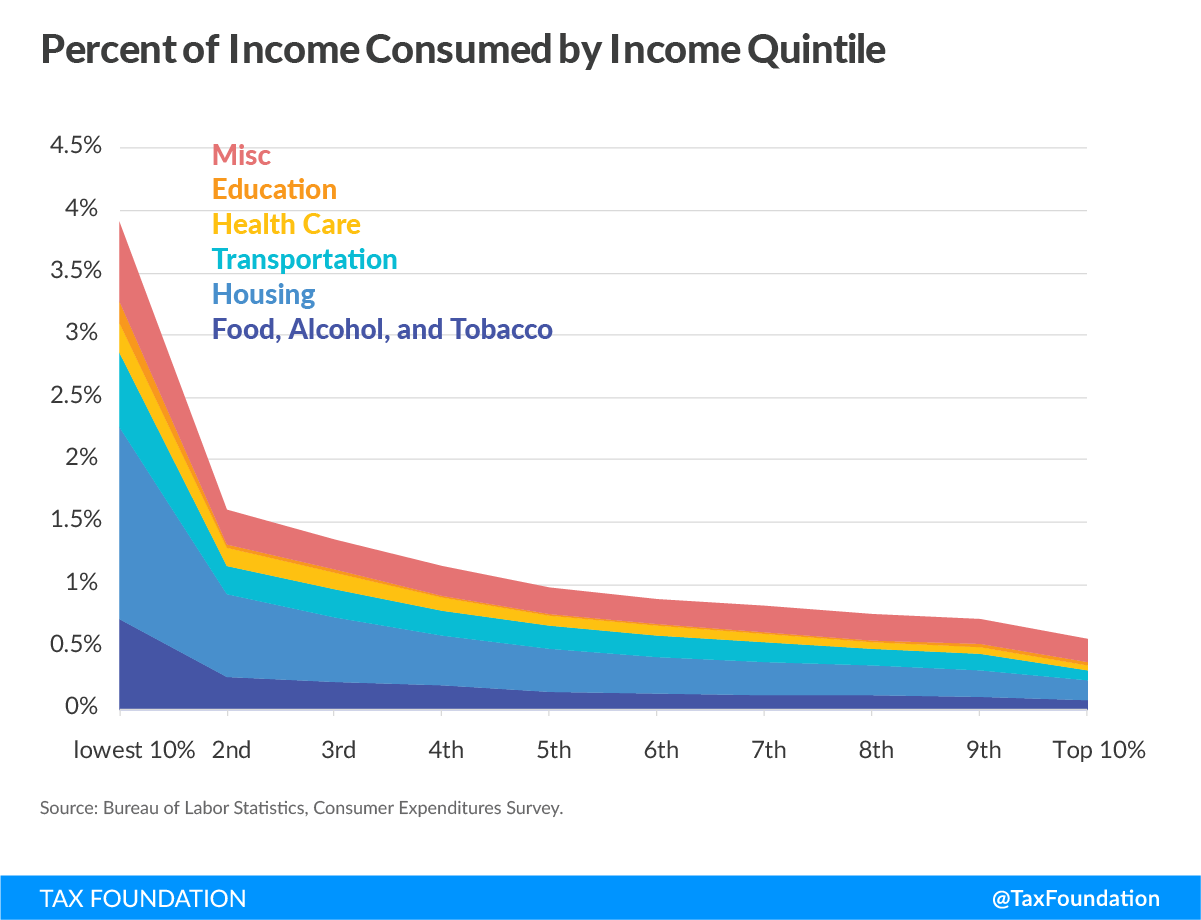
On average, U.S. personal saving rates are historically low, around 5 percent of income. Conversely, business investment from retained earnings, which is part of national saving, is significantly higher, around 42 percent for corporations. Households’ higher propensity to consume and lower average saving rates suggests that tax relief to individuals has more crowding out than tax relief that is extended to businesses.
Figure 2.
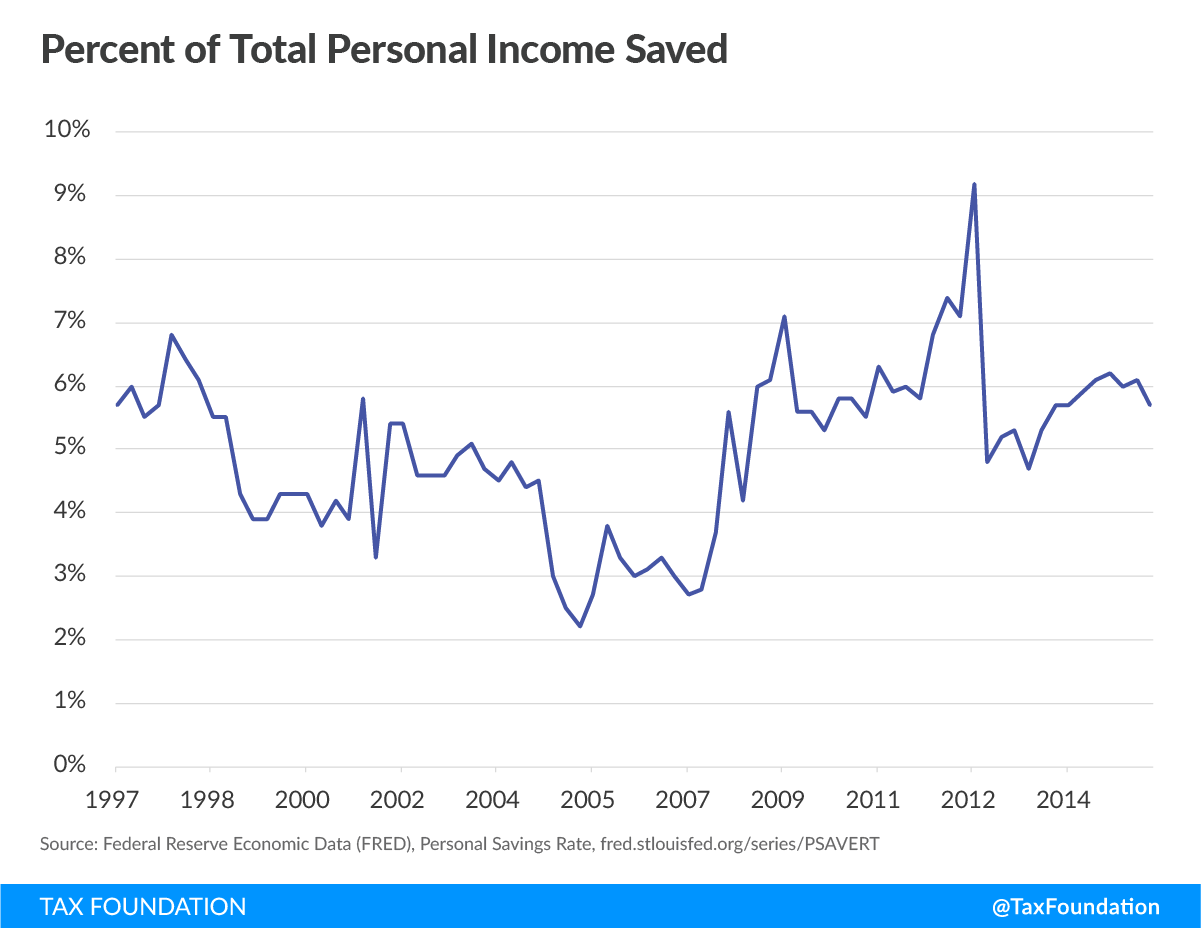
This suggests deficits used for tax cuts should experience considerably less crowding out than deficits used for government spending or transfers. Empirical research supports this finding. Giavazzi et al. (2000) found that private saving increased by as much as 50 cents for each dollar of deficit spent on the consumption of government goods and services, while private saving increased by as much as 97 cents for each dollar of deficit spent on tax policy. [5] Rohn (2010 ) reported similar differences in saving between an increase in government expenditures and a reduced tax burden. [6] These results are even more impressive in that the studies did not discriminate between tax cuts that were structured to improve the after-tax return on investment and saving, and those that did not. Had they done so, we suspect that they would have shown a larger positive effect on saving and investment from tax reductions that reduced the required pretax returns.
International Financial Flows Supply Large Amounts of Saving for Investment
The United States is an open economy closely integrated with world financial markets. The U.S. has access to large amounts of global saving, and can attract it with very small increases in interest rates or returns on direct investment in real assets.
Some macroeconomic models wrongly treat the U.S. economy as largely closed to international financial flows. These models limit the availability of saving, overstate the effect of deficits on economic growth, and understate the power of pro-investment, pro-saving tax reforms to boost investment, wages, and employment. Their predictions are off the mark, and hamper Congress’s work on tax reform.
Other macroeconomic models treat the United States as an open economy with access to world saving and financial flows. However, there are two types of open economy, large or small. A “large open economy” is big enough to sway the worldwide return to investment. Some models classify the United States economy as big enough to do that. As such, an increased demand for investment by the U.S. government would affect the world interest rates and crowd out not only U.S. investment but world investment. That view is also incorrect. It may have been the case in 1960, when the United States was roughly 40 percent of the world economy (and more than half the free world economy), and the communist bloc did not matter for investment and trade. Today, U.S. GDP is less than 25 percent of the global economy, [7] and financial flows and trade with China, Eastern Europe, and Russia are significant. The U.S. share of the global economy continues to drop as other nations continue to develop. [8] The United States is no longer a “large open economy.”
In recent decades, the United States has acted like a “small open economy.” It can increase government borrowing and have little or no effect on the interest rate it pays. The interest rate on government debt seems to be unresponsive to increases in demand. The disconnect between how the U.S. economy is modeled and the data stems from the rapid growth in the rest of the world. As new countries develop and comprise a greater portion of the world economy, the United States holds less sway over world prices.
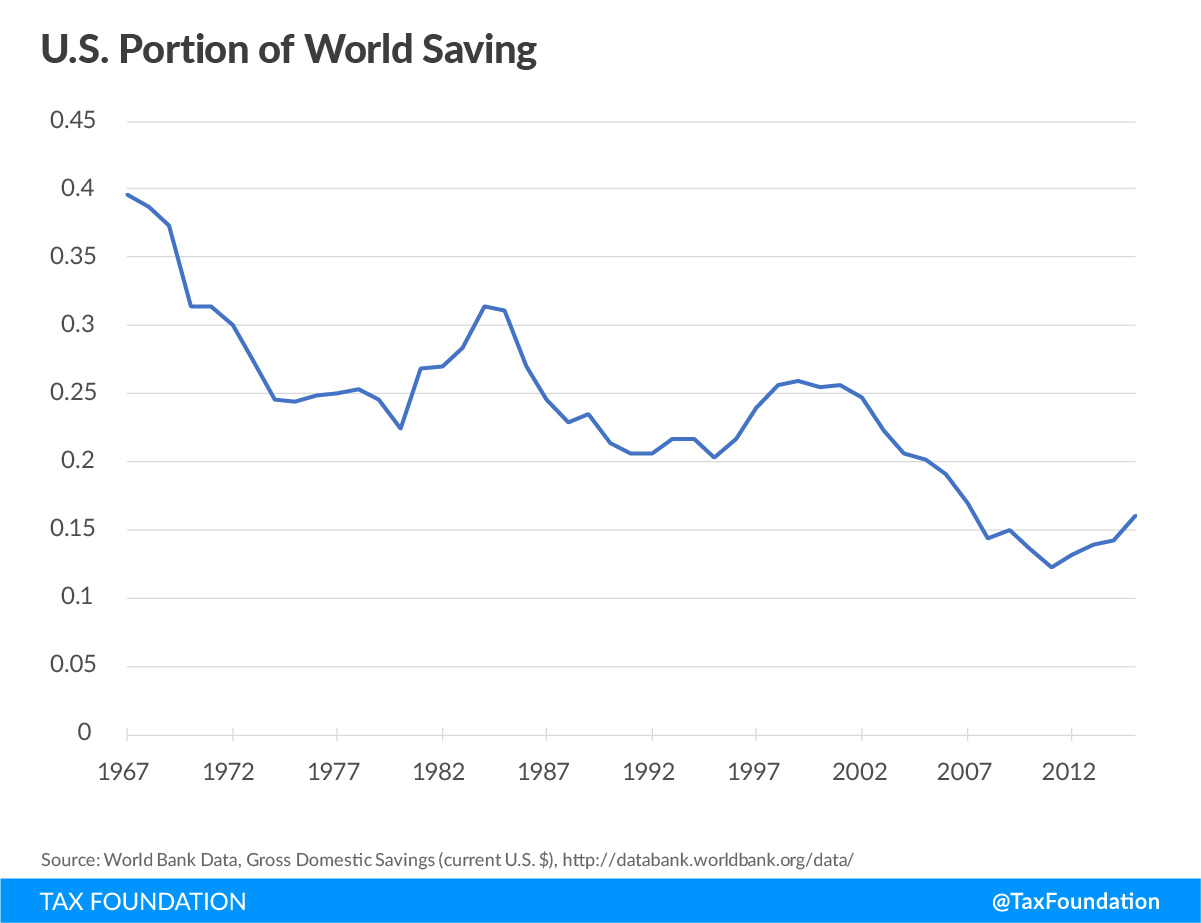
There is considerable debate over the extent to which world saving can cover U.S. private investment. If the United States is integrated into the world economy and there is sufficient world saving, then domestic private saving is not a binding constraint on private business investment. World GDP is approximately $75 trillion and, on average, 25 percent of world output is saved. This amounted to $20 trillion of saving in 2015 alone. The same year, the United States only saved $3 trillion, less than 16 percent of total saving. [9] It ran a $435 billion government budget deficit in FY 2015, and tapped only 2.6 percent of the rest of the world’s saving to cover it.
The World Bank forecasts GDP and global saving to grow substantially over the next decade. Well over $250 trillion dollars in new global saving will occur, enough to cover government deficits around the world as well as a significant expansion of private investment. To put this in context, the projected increased U.S. deficit for providing permanent bonus depreciation is less than 0.2 percent of the available foreign saving over the same period. That assumes the provision does nothing to raise GDP, revenue, and U.S. saving.
Figure 3.
Foreign saving is drawn into the U.S. economy through the international financial markets. These markets attempt to equalize returns to saving by reallocating saving from projects and countries with low returns on investment to projects and countries with high returns on investment, adjusted for risk. In the process, countries become less constrained by their national saving, and find increased ability to finance economically feasible investment projects. Consequently, international financial flows can supplement national saving when government borrowing increases.
When foreign goods and services are sold in the United States, the revenues from the transactions can purchase U.S. goods and services to be sent back to the country of origin or used to purchase investments in the United States. Currency markets facilitate this process by changing the exchange rate so that the value of goods, services, and investment instruments in one country matches the goods, services, and investment instruments in another. In addition, current interest rate differentials across borders, the forward markets for currencies, and bond and interest rate futures help to equalize these accounts.
When a country exports more than it imports, the difference must be made up by buying more assets from abroad than it sells, or the exporting country’s currency will appreciate to clear the currency markets. Similarly, when a country imports more than it exports, the difference must be made up by selling more assets than it buys, or the importing country’s currency will depreciate.
When the government increases borrowing, the demand for saving increases, but U.S. government debt is considered a safe investment throughout the world. The increased demand pushes up the interest rate, but by only a small amount. The small increase draws in risk-adverse saving from every corner of the globe, which causes the U.S. dollar to appreciate. With a stronger U.S. dollar, U.S. consumers increase the portion of imported goods and services they consume, given that they are relatively less expensive, and the trade deficit widens.
The inflow of goods allows output and investment to remain unchanged while private and government consumption increases. In other words, expanding government debt in an open economy simply increases imports, but does not crowd out private investment. This is consistent with the national income identity, which equates net exports with net inflows of investment. When imports are greater than exports, the net-exports term in the equation becomes negative, indicating a financial inflow from the net sale of assets. This allows the sum of private consumption, investment, and government consumption to be greater than national output.
These financial and trade flows facilitate the expansion of the economy. The drop in the trade balance does not cause slower U.S. growth; rather, it is the result of faster U.S. growth. Increased foreign ownership of U.S. assets means that more dividends and interest flow to foreigners, but U.S. workers are employed to work with the added plant and equipment located in the United States, which raises productivity and U.S. wages.
Several studies support the observation that financial flows mitigate crowding out. Chinn and Prasad (2003) show that for each additional dollar of government debt, there is 31 to 38 cents of additional financial inflow from other countries. [10] This is in addition to 56 cents of additional private domestic saving. Between the two effects, it is clear that most of the additional demand for saving is offset by increases in domestic private and foreign saving.
Chinn and Ito (2007) echo the findings in Chinn and Prasad. Using only industrialized countries, Chinn and Ito found stronger responses from private saving, which increased by 80 cents per dollar of government borrowing, while foreign financial flows increased by 15 to 20 cents per dollar borrowed. [11] Chinn et al. (2011) found similar results among developed countries with 52 cents of increased private saving and 29 cents of increased financial flows. [12] In most of these estimates, more than 80 cents in saving offset are generated for each dollar borrowed.
Empirical Evidence Finds Little Relationship between U.S. Government Borrowing and Interest Rates on Government Debt
There are several problems with the models that predict a large rise in interest rates from higher federal borrowing. First, changes in the amount of government borrowing do not seem to move the interest rate on government debt very much. Second, the Federal Reserve often steps in to dampen whatever interest rate effect might occur by buying government bonds and increasing the availability of credit. These two observations suggest that the supply of saving and credit to the economy is highly flexible.
Third, although household saving is only moderately responsive to interest rates, it is not the only source of additional saving for buying government bonds, and not the only source of funds for supporting business investment. Saving by businesses, which is very flexible, and international financial flows are major additional sources. Fourth, the interest rate faced by private borrowers has not shown a great tendency over time to rise or fall relative to rates on U.S. Treasury securities in the presence of federal deficits.
These observations suggest that the cost of borrowing for businesses may be only tangentially related to the cost of borrowing for the government. If this is the case, changes in the interest rate on government bonds may not affect the cost of business investment, and any crowding out effects cannot be traced to higher interest rates on government debt.
Interest rates for U.S. Treasury securities tend to have a weak response to government borrowing. Thomas Laubach (2009) estimated that for each percentage point increase in the debt to GDP ratio, there is a 3 to 4 basis points increase in the interest rate. [13] To put this in perspective, the U.S. could increase the federal debt by $4.5 trillion, the same as 10 years of corporate tax revenue, and the interest rate would increase from the current inflationInflation is when the general price of goods and services increases across the economy, reducing the purchasing power of a currency and the value of certain assets. The same paycheck covers less goods, services, and bills. It is sometimes referred to as a “hidden tax,” as it leaves taxpayers less well-off due to higher costs and “bracket creep,” while increasing the government’s spendin-adjusted rate of 0.5 percent to less than 1.5 percent, which is still below the current inflation-adjusted interest rate on AAA-rated corporate bonds of 1.9 percent. [14]
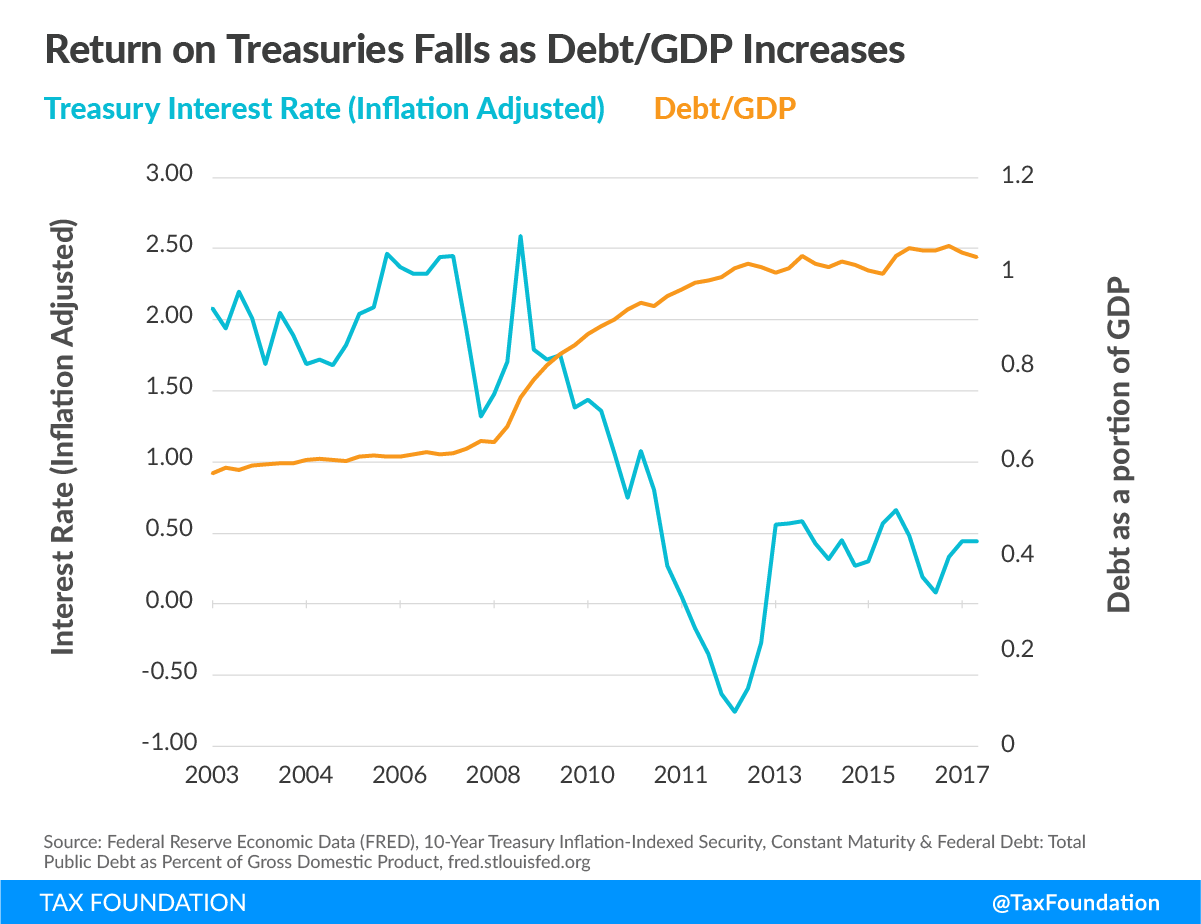
Even that interest rate reaction may be too strong. Over the last decade, Laubach’s relationship between interest rates and the size of the national debt seems to have broken down. From 2006 to 2016, the national debt to GDP ratio increased by almost 44 percentage points, while over the same period, real interest rates on U.S. Treasury securities fell by more than 2 percentage points. In 2007 alone, the national debt to GDP grew by a historic 13 percentage points while the real interest rates on 10-year Treasury bonds only increased by 11 basis points. [15]
Activity by the Federal Reserve helps explain part of this disconnection between Treasury interest rates and the size of the national debt over the decade. In November 2008, the Federal Reserve began a program of “quantitative easing” in response to the Great RecessionA recession is a significant and sustained decline in the economy. Typically, a recession lasts longer than six months, but recovery from a recession can take a few years.. This program purchased $2.1 trillion of Treasuries and other assets through an expansion in the money supply over a period of five years. The program injected additional funds into the credit markets, reducing the need for increased household saving to fund the deficit (and discouraging it by lowering the interest rates). Since most of the expanded money supply was used to purchase U.S. Treasury securities, quantitative easing put downward pressure on the interest rates on government debt relative to other investments.
In 2015, the national debt to GDP ratio grew by almost 3.5 percentage points while interest rates on Treasury debt fell by 18 basis points. This flies in the face of Laubach’s predicted 14 basis points’ increase. Unlike 2007 or 2008, the U.S. economy was in recovery in 2015. This postrecession period did not have the quantitative easing to expand credit and relieve the burden on saving, yet real interest rates continued to fall.
Figure 4.
Some economists have argued that the world financial markets are currently in a “saving glut” and that they readily snap up additional creditworthy debt offerings without requiring a higher interest rate, particularly for safe assets like U.S. Treasury securities. [17] The saving glut could explain the odd trend in the relationship between the quantity of Treasury debt and the real interest rates it pays.
Deficit Spending Appears to Raise Private Saving.
Despite the empirical studies that find weak connections between government debt and interest rates as well as interest rates and saving, many empirical studies support the hypothesis that deficit spending increases private saving. Edwards (1996) found that private saving increased by 55 cents for each dollar borrowed using data from developed and developing countries from 1970 to 1992. [18] Loayza et al. (2000) used data from the Organisation for Economic Co-operation and Development (OECD) from 1970 to 1996. [19] They found that the increase in saving depended on the time frame. In the short run, private saving increases from 6 to 39 cents per dollar of deficit spending, but in the long run, the range increases to a low of 34 and a high of 93 cents per dollar of deficit spending.
These saving responses are significant, and go a long way toward offsetting any crowding out of investment by government deficits. That said, when interest rates have increased in the past, the saving response by U.S. households has been moderate at best. More of the U.S. private sector saving response has come from changes in business saving.
At higher interest rates, households respond by delaying consumption and increasing saving, preferring more future consumption to current consumption (and perhaps preferring not to borrow when consumer interest rates are high). The increased saving helps to expand available funds in the credit market. The extent to which saving expands depends on the elasticity of saving, which is the response of saving behavior to interest rates. Recent studies have estimated the elasticity of saving to be around 0.4; that is, households respond to a 10 percent increase in the interest rate by increasing their saving by 4 percent. This suggests that U.S. household saving behavior has only a moderate response to changes in the interest rate.
It is possible that interest rates alone do not reflect the overall return to saving. Purchasing equity in a business venture is a form of investment which provides a return but is only tangentially connected to the bond markets. Equity has more risk, but generally, garners higher returns. The return to debt and equity can often diverge, particularly when the money supply is in flux. As such, changes in the interest rate may not reflect the actual return to saving, which may help to explain the disconnect between interest rates and saving rates.
Models Typically Assume Saving is Relatively Fixed, and Deficits Raise Interest Rates and Curb Investment
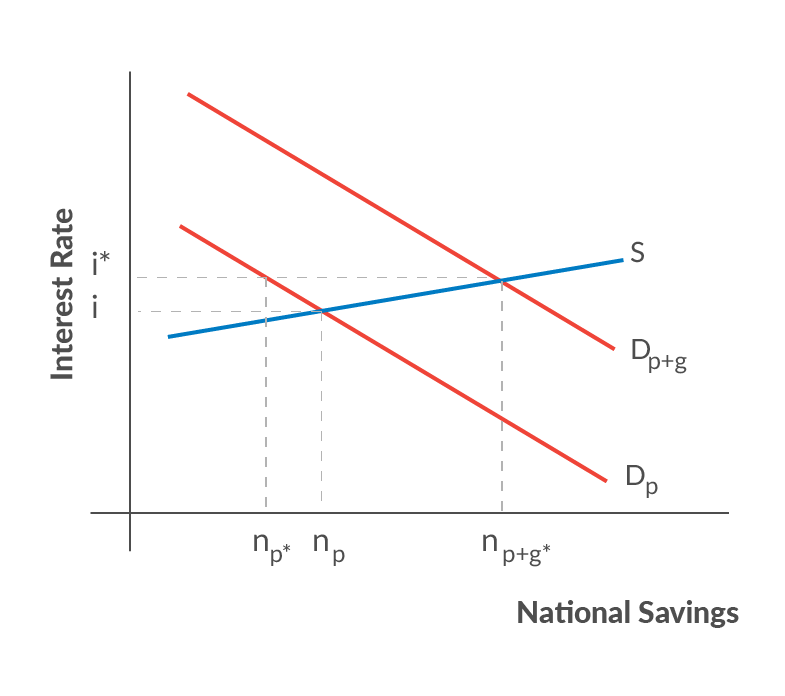
Typically, macroeconomic models assume that higher interest rates stem from the scenarios that create a scarcity of funds that act to constrain business investment. In the models, credit markets are modeled with a supply curve, which represents saving supplied by households, and a demand curve, reflecting government and net business borrowing demand for funds, all lumped together. As the interest rate rises, households save more, government borrows what it wants, and businesses are pressured to demand less. This continues until the amount of money saved equals the amount of money borrowed.
Figure 5.
Crowding Out Within the JCT Scoring Model
JCT implicitly includes an assumed amount of crowding out in its estimates of economic changes from tax policy. For example, in 2015, JCT released an estimate of the economic and budgetary effects if bonus expensing were made permanent. In its analysis, JCT reported no economic growth effects from the provision. JCT argued, “In the longer run, increasing federal debt is expected to reduce the investment incentives provided by the proposal.” In other words, JCT believes that the increase in deficit spending required to make bonus expensing permanent would crowd out the saving available for business investment. Thus, any cash-flow advantage to businesses from bonus expensing would be offset by an increase in the cost of borrowing and a reduction in the availability of funds for private investment.
However, as discussed above, government borrowing does not seem to increase interest rates or reduce the availability of saving for investment in the U.S. economy. The availability of foreign saving and more domestic saving from additional income created through tax reduction or economic growth tend to offset the increase in demand for saving from government borrowing. In turn, interest rates only need to rise a minuscule amount for the availability of saving to meet demand.
JCT’s results assume that the saving available for investment is somewhat fixed. Although its model has international financial flows that can rise or fall in response to interest rates and intertemporal substitution effects, the responses built into the model are small compared to the increase in the deficit spending. As such, the model predicts that increases in the national debt starve business investment of available saving, which reduces growth.
The assumed elasticities of international financial flows and intertemporal saving, particularly from businesses, are too small to represent the current U.S. economy. The elasticities should be adjusted to reflect the integration of the U.S. into the global banking system and credit markets. This includes the fact that global saving is far greater than the additional demand from deficit spending for tax reform. The elasticities of saving should include businesses’ propensity to save with respect to a service price of capital as well as individuals’. Adjusting these parameters can improve the JCT’s macroeconomic scores.
Conclusion
The Joint Committee on Taxation is right to consider the effects of the national debt on investment. Macroeconomic models should have mechanisms that capture the inner workings of the U.S. economy. However, the strict assumption on the rigidity of domestic saving and the lack of availability of global saving in some of the current models may not reflect the reality in our global economy.
A significant portion of government outlays and tax reduction goes directly into private saving, even before taking account of any changes in incentives to save or invest. International financial flows and foreign investment can cover the domestic saving-investment gap with saving from the rest of the world. The most recent literature has shown that, between these two factors, deficits have no effect on the availability of saving for private investment, particularly when the borrowed money is used to provide tax relief for investment and saving.
Tax policy should pay attention to the costs of increasing the national debt, but the effects should be assumed to lie within the bounds of current research based on historical observations. As such, JCT could improve the accuracy of its models by relaxing its assumptions about the availability of saving for private investment.
Rather than focusing on the means of funding investment, JCT should focus on the incentives to invest. By concentrating on incentives, models require fewer assumptions about the future of the U.S. economy and rely more on America’s ingenuity when opportunities exist. This leaves room for economic actors to solve issues creatively in ways that may surprise economists. As such, models where growth is governed by the profitability of an investment rather than the availability of domestic saving are more likely to provide informative predictions of the future and give policymakers an accurate view of the trade-offs of tax policy reform.
Appendix of Supporting Material
The accounting approach to saving and investment rests on the equations of the national income identity. These identities are truisms: they must always hold true. However, the accounting identities among the pieces of GDP do not tell us anything about whether the total GDP and the components are high or low. They do not explain why people save or consume, why people invest or disinvest, or buy domestic goods or imports. Importantly, they do not tell us which pieces move to adjust if one of the others is altered by government policy. To know that requires an understanding of economic behavior. One cannot move one of the pieces by government policy and arbitrarily hold all but one of the remaining pieces constant and assume that the last variable piece does all the adjusting.
The relevance to the crowding out controversy is this: one cannot arbitrarily assume that a rise in government spending or a cut in taxes faces a fixed level of saving or net capital inflow, such that the only possible adjustment is a decline in investment. One must determine if the tax or spending change alters desired investment, domestic saving, or the capital account.
The basic equation for GDP from the spending side is:
GDP = C + I + G + NX
Where C is consumption by the private economy, I is investment, G is government purchases, and NX is net exports. The total is equal to national output and income.
Income may be used for consumption, saving, or paying taxes. GDP from the uses of income side is:
GDP = C + S + T
Equating the two GDPs, and subtracting C and T from both sides, gives us the importance of saving for funding investment and the government deficit. In the absence of any foreign sectors:
S = I + (G – T).
If S is assumed constant, any rise in G or reduction in T must reduce I: “crowding out.” But if a cut in T induces people to increase S (save more), then investment (I) may fall by less than the rise in the deficit. If the tax cut is particularly pro-investment, it could lead to a large enough rise in saving that investment could even increase.
If there is a foreign sector, NX equals exports less imports (X-M), which is also equal to the capital inflow, -(M-X), which is foreign purchases of U.S. assets less U.S. purchases of foreign assets. [21] The capital inflow can help to cover investment and the government deficit:
S + (M-X) = I + (G-T)
When G exceeds T, the government is running a deficit. When T exceeds G, government is running a surplus, called “government saving.”
Net government saving or borrowing is the difference between taxes and government expenditures:
Sg = T – Ge
If taxes are larger than government expenditures, the government pays down the national debt; if taxes are lower than government expenditures, the government issues new debt. Thus, government saving can be negative or positive.
However, the government saving identity is not completely correct. The variable G in the national income identity includes government purchases of goods and services, such as government payroll, but the government also gives transfers to the private sector paid from taxes and pays the interest on the debt. As such, transfers need to be removed from the taxes to account for the total surplus or deficit by the government. For demonstration purposes, let’s assume the interest on the debt is zero.
Sg = T – Tr – G [22]
When an individual receives income from working or investments, s/he can distribute the income between consumption and saving. Let’s assume everyone in the U.S. has the same preferences and incomes. As such, the amount saved or consumed would be a constant share of their after-tax and transfers income. Let “a” be the preferred portion our representative individual would allocate to saving. Inversely, the proportion consumed is 1-a. Let “Y” denote the total wages and returns from investment in the economy.
Sp = a(Y – T + Tr)
C = (1-a)(Y – T + Tr)
National saving is the sum of both private saving and government saving. If we substitute our equation for private saving and government saving into the national saving identity, we can observe the effects of decreasing taxes, increasing transfers, or increasing government expenditures on national saving.
Sn = a(Y – T + Tr) + T – Tr – G = aY + (1-a)T – (1-a)Tr – G
By differentiating national saving by taxes, transfers, and government expenditures, we can infer the marginal effect of these three policies on national saving.
dSn/dT = (1-a)
For each dollar of tax cuts funded by government borrowing, national saving falls by 1-a, which is less than one. If the propensity to save is high, represented by a larger value of “a,” then the crowding out effect is minimal; but if the propensity to save is low, then there is a significant crowding out of national saving.
dSn/dG = -1
Conversely, government consumption through government borrowing crowds out national saving dollar for dollar. This suggests that tax cuts funded by government borrowing will have a milder impact on the pool of national saving than spending the money on government purchase.
Government transfers have a similar effect to tax cuts but with a caveat. Transfers incur an administration cost that tax cuts do not. A change in the tax rate does not affect the number of government employees. In some instances, removing a tax could reduce administrative costs, but instituting a new transfer program requires government employees to administer transfers. Due to the administration costs, more of the government transfer is consumed than flows into saving.
Let “b” denote the administrative portion of each dollar spent on transfers. As such, the reflow from transfer spending is the weighted sum of the marginal change from transfers and the government purchases. In this case, transfers have less crowding out compared to government purchases but should exhibit more crowding out than tax cuts.
dSn/dTr = -(1-a)(1-b) – b
(1-a+ab) > (1-a)
Holding prices constant, reflows from tax cuts or government expenditures reduce the crowding out of national saving available for private investment, but the extent of crowding out depends where the borrowed dollar is reallocated. Spending the borrowed dollar on government purchases is more likely to cause crowding out tax cuts, with transfer payment falling between the two.
[1] See the Appendix for details.
[2] Bart Hobijn and Alexander Nussbacher, “The Stimulative Effect of Redistribution,” FRBSF Economic Letter 2015-21 (June 29, 2015), goo.gl/cqR1ww.
[3] Although paying consumer debt appears as consumption, the effect on net wealth of the individuals is effectively saving. Moreover, paying consumer debt increases the assets of the lender, which expands the pool of saving available for investment.
[4] In general, tax reduction does not increase administrative cost. However, reducing overall tax burden through child credits or EITC will increase administrative costs. This is because the child credit and EITC are effectively government transfers distributed through the tax system.
[5] Francesco Giavazzi, Tullio Jappelli, and Marco Pagano, “Searching for Non-Linear Effects of Fiscal Policy: Evidence From Industrial and Developing Countries,” European Economic Review 44, no. 7 (June 2000), 1259–1289.
[6] Oliver Röhn, “New Evidence on the Private Saving Offset and Ricardian Equivalence,” OECD Economics Department Working Paper 762 (May 6, 2010).
[7] It is even less, under 16 percent, on a purchasing power parity basis.
[8] Such as BRIC countries: Brazil, Russia, India, and China.
[9] The World Bank database, “Gross domestic savings (% of GDP),” https://data.worldbank.org/indicator/NY.GDS.TOTL.ZS.
[10] Menzie D. Chinn and Eswar S. Prasad, “Medium-Term Determinants of Current Accounts in Industrial and Developing Countries: An Empirical Exploration,” Journal of International Economics 59, no. 1 (January 2003), 47–76.
[11] Menzie D. Chinn, Menzie D., and Hiro Ito. 2007. “Current Account Balances, Financial Development and Institutions: Assaying the World ‘Saving Glut,’” Journal of International Money and Finance 26, no. 4 (June 2007), 546–569.
[12] Menzie D. Chinn, Barry Eichengreen, and Hiro Ito, “A Forensic Analysis of Global Imbalances,” NBER Working Paper 17513, National Bureau of Economic Research (October 2011), http://www.nber.org/papers/w17513.
[13] Thomas Laubach, “New Evidence on the Interest Rate Effects of Budget Deficits and Debt,” Journal of the European Economic Association 7, no. 4 (June 2009), 858–885.
[14] 10-Year Treasury Inflation-Indexed Security, Constant Maturity, 2017, FRED data.
[15] Moody’s Seasoned Aaa Corporate Bond Yield, 2017, FRED data, adjusted for inflation based on inflation-indexed treasuries.
[16] Alexander Rodnyansky and Olivier Darmouni, “The Effects of Quantitative Easing on Bank Lending Behavior,” The Review of Financial Studies 30, issue 11, (Nov. 1, 2017), 3858–3887.
[17] Bernanke, Ben S., “Global Imbalances-Links to Economic and Financial Stability,” speech at the Banque de France Financial Stability Review Launch Event, “Feb. 18, 2011.”
Chinn, Menzie D., and Hiro Ito, “Current Account Balances, Financial Development and Institutions: Assaying the World ‘Saving Glut,’” Journal of International Money and Finance 26, no. 4, (June 2007), 546–569.
[18] Sebastian Edwards, “Why Are Latin America’s Savings Rates So Low? An International Comparative Analysis,” Journal of Development Economics 51, no. 1 (October 1996), 5–44.
[19] Norman Loayza, Klaus Schmidt-Hebbel, and Luis Servén, “What Drives Private Saving Across the World,” Review of Economics and Statistics 82, no. 2 (May 2000), 165–181.
[20] CBO also has used a 0.4 elasticity of saving in models of the U.S. economies. Jonathan Gruber, “A Tax-Based Estimate of the Elasticity of Intertemporal Substitution,” NBER Working Paper 11945, National Bureau of Economic Research, January 2006.
[21] Exports add to the purchases of U.S. goods; imports do not subtract from U.S. output; they are shown with a minus sign because the consumption term C contains purchases of domestic and foreign goods (including M), and it would otherwise overstate domestic output not to subtract them.
[22] The overall identity for the government budget includes the issuing of bonds and interest payments as part of the equation. As such, (1+r)b t-1 + G + Tr = T + b t, where b are government bonds, balances the government budget.
Share this article