In November, the Congressional Budget Office (CBO) released the latest annual edition of its report on the distribution of household income and federal taxes, with data for 2011. The CBO study confirms that the federal taxA tax is a mandatory payment or charge collected by local, state, and national governments from individuals or businesses to cover the costs of general government services, goods, and activities. system is progressive. It further shows that government transfers to households are also progressive. (For a brief overview of CBO’s findings, see here.)
A way to measure the combined distributional impact of taxes and transfers is to ask: How many dollars of transfers does a household receive for each dollar of taxes it pays? That is, what is the ratio of transfers to taxes? The answer, according to CBO’s numbers, is that the transfer-tax ratio is very large for low-income households, very small for high-income households, and in between for average-income households.
CBO’s computations include all major federal taxes: individual income, corporate income, payroll, and excises. CBO counts transfers to households from federal, state, and local governments, including Social Security, Medicare, and numerous means tested programs. The data sets cover 33 years, beginning in 1979 and now extending through 2011.
CBO groups households into quintiles (fifths of the population sorted by income). The specific households in each quintile change from year to year. For example, a couple just starting out in 1979 might have been in the lowest 20 percent of income that year. Over time, though, the couple probably moved up the income ladder into higher quintiles.
For the lowest quintile of households in 2011, CBO estimates that the average household in the quintile received $9,100 in transfers compared to paying $500 in taxes. (See the Table.) That is a transfer-tax ratio of 1820 percent ($18.20 of transfers per $1 of taxes).
|
Ratio Of Transfers To Taxes by Household Income Quintiles, 2011 |
|||
|
Quintile |
Government Transfers |
Federal Taxes |
Transfer to |
|
Lowest 20 Percent |
9,100 |
500 |
1820% |
|
Second 20 Percent |
15,700 |
3,200 |
491% |
|
Middle 20 Percent |
16,500 |
7,400 |
223% |
|
Fourth 20 Percent |
14,100 |
14,800 |
95% |
|
Highest 20 Percent |
11,000 |
57,500 |
19% |
|
Top 1 Percent |
10,600 |
421,100 |
2.5% |
|
All Households |
13,300 |
16,600 |
80.1% |
|
Source: Data from Congressional Budget Office, The Distribution of Household Income and Federal Taxes, 2011. |
Figure 1 displays the transfer-tax ratio for the lowest quintile in each year since 1979. It can be seen that the ratio for the lowest quintile has consistently been above 500 percent, climbed temporarily and with a lag in the years following the 1990-1991 and 2001 recessions, and has soared since the Great RecessionA recession is a significant and sustained decline in the economy. Typically, a recession lasts longer than six months, but recovery from a recession can take a few years. . The ratio peaked in 2009, but is still several times higher than in any year before 2008.
For the second 20 percent of households, CBO estimates transfers averaged $15,700 and federal taxes $3,200, for a transfer-tax ratio of 491 percent.
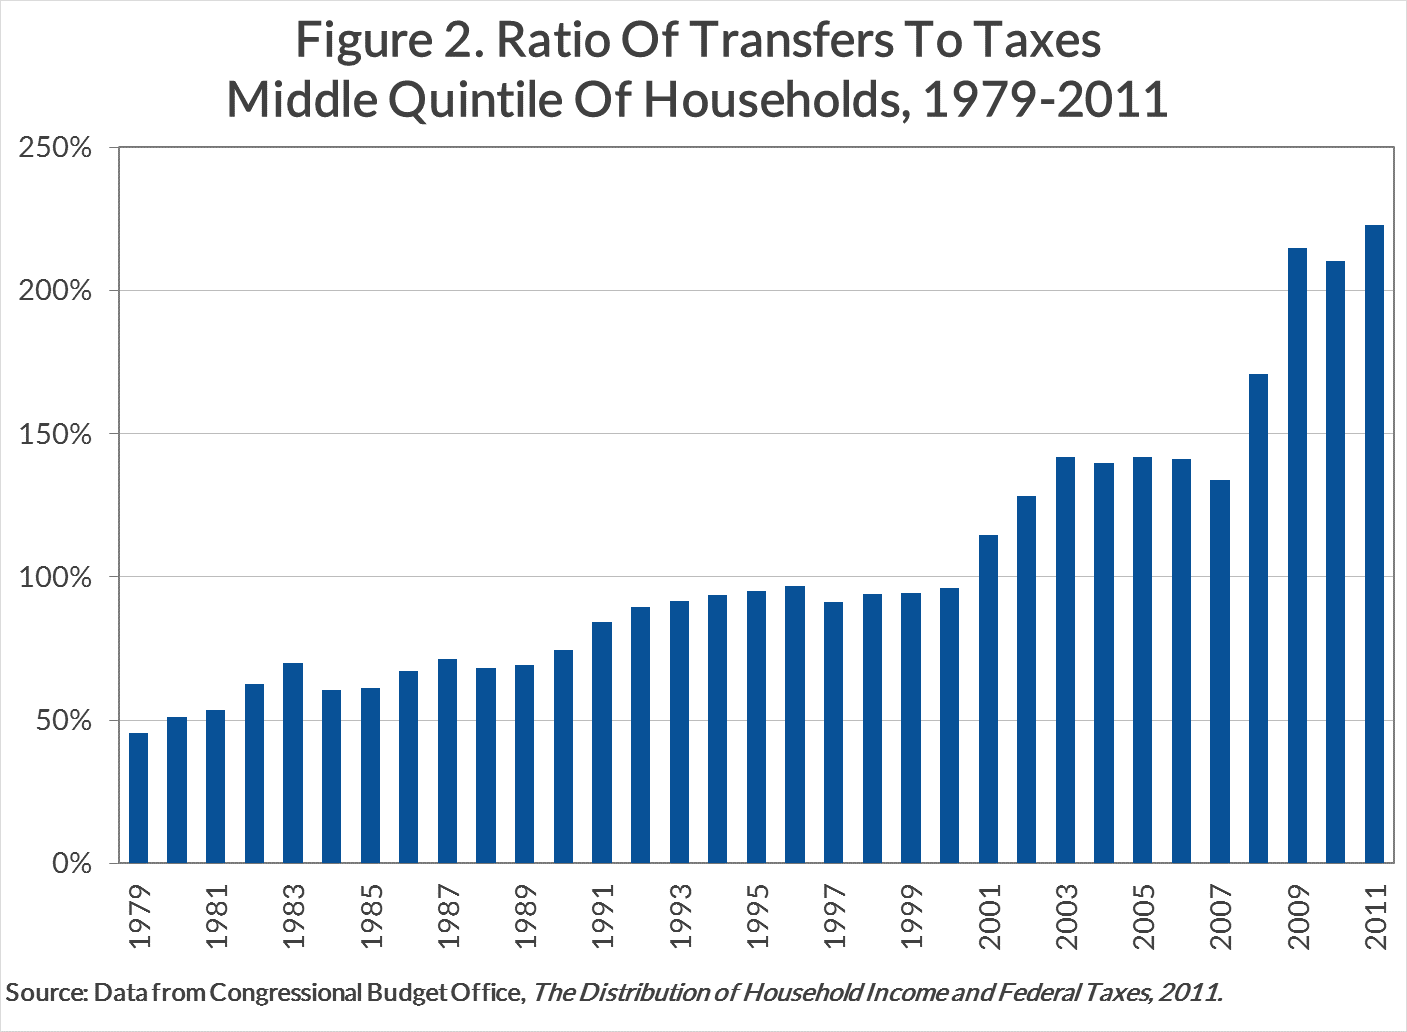
For the middle quintile in 2011, CBO estimates the average household in the quintile received $16,500 in transfers and paid $7,400 in taxes, producing a transfer-tax ratio of 223 percent. Figure 2 shows what the ratio for the middle quintile has been in every year since 1979. The transfer-tax ratio was below 50 percent in 1979 but has been increasing since then, especially during recessions. The middle quintile’s transfer-tax ratio first exceeded 100 percent in 2001. The ratio jumped in 2009, although the change was not as extreme as for the lowest quintile.
For the fourth 20 percent of households in 2011, transfers averaged $14,100 and taxes $14,800, for a ratio of 95 percent. At this income level, many of the transfers are from Social Security and Medicare.
The highest quintile is the only one paying substantially more in taxes than it obtains in benefits. Transfers averaged $11,000 and taxes $57,500, for a transfer-tax ratio of 19 percent.
For the top 1 percent of households in 2011, transfers are even smaller compared to taxes. CBO estimates that, on average, the 1 percenter received $10,600 of transfers but paid $421,100 of taxes. Hence, the transfer-tax ratio was 2.5 percent (2.5 cents of transfers per $1 of taxes). In contrast to the lowest and middle quintiles, the transfer-tax ratio has not risen for the top 1 percent over the period 1979-2011, according to CBO’s numbers. (See Figure 3.)
The perception that upper-income households, especially the top 1 percent, pay relatively less tax than other people is the opposite of what tax data show. Even more pronounced is how much upper-income households pay in tax compared to the government transfers they receive. The CBO’s numbers do not establish whether the current distribution of strikes the right balance. But they do tell us the transfer and tax system is very redistributional.
(For an in-depth Tax Foundation study that compares taxes and spending at all levels of government, see here. The study differs in many ways from CBO’s. It does not show as much redistribution as CBO’s data indicate, but still finds a great deal.)
Share this article

