Presidential candidate Donald J. Trump released his taxA tax is a mandatory payment or charge collected by local, state, and national governments from individuals or businesses to cover the costs of general government services, goods, and activities. plan on Monday, and we released our analysis on Tuesday. When we analyze tax plans, we do it to help guide an accurate conversation about the revenue and distributional effects of the substantive proposals put forward by candidates. To that end, I would like to address two narratives put forward in the conversation about Mr. Trump’s plan.
The first of these narratives, largely driven by outside analysts, is that Trump’s plan is mostly about reducing taxes for the wealthy. For example, Jonathan Chait, Catherine Rampell, Benjy Sarlin, and Kevin Drum chose to focus on this particular aspect of the plan. Taken individually, each of these are perfectly fine news stories; however, taken together, they begin to form a consistent but incomplete characterization of a plan that also contains a very large middle-class tax cut.
The second of these narratives comes from Mr. Trump himself: that the plan can be revenue-neutral under “moderate” economic growth. This is not right; the plan is a very large tax cut, which is apparent from even a cursory look at the details. The estimate of our Taxes and Growth Model is that it would reduce revenues between $10 and $12 trillion over ten years, though the precise amount would depend on additional details.
The purpose of this post is to help illustrate the degree to which Mr. Trump’s plan would reduce the amount paid in taxes by the middle class (and therefore, reduce revenues collected by the government.) Here is the amount by which after-tax incomeAfter-tax income is the net amount of income available to invest, save, or consume after federal, state, and withholding taxes have been applied—your disposable income. Companies and, to a lesser extent, individuals, make economic decisions in light of how they can best maximize their earnings. would increase, for each income decile, under the Trump plan.
|
All Returns by Decile |
Static Distributional Analysis |
|
0% to 10% |
1.4% |
|
10% to 20% |
0.6% |
|
20% to 30% |
1.2% |
|
30% to 40% |
3.0% |
|
40% to 50% |
5.3% |
|
50% to 60% |
7.2% |
|
60% to 70% |
8.0% |
|
70% to 80% |
8.3% |
|
80% to 90% |
8.9% |
|
90% to 100% |
14.6% |
I understand the interest in the highest end of the distribution, but those large tax cuts in the 30th to 90th percentile are an important story as well. At the New York Times, Josh Barro devoted some of his analysis to covering it. “In addition to offering huge cuts to the rich and to business owners (including me!),” wrote Barro, “Mr. Trump would offer huge tax cuts for the middle and upper-middle class.” Needless to say, our distributional tables thoroughly back up this claim.
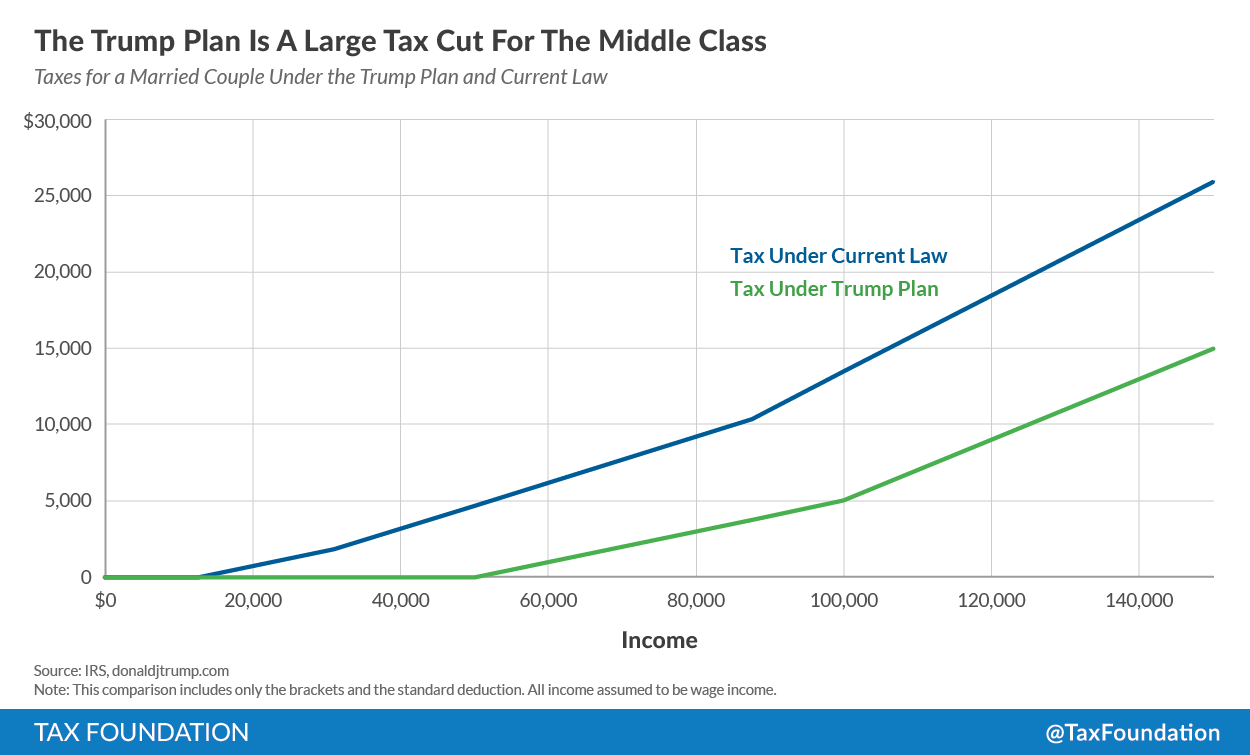
A look at Mr. Trump’s bracket structure easily explains why it is a tax cut for the middle and upper-middle class. There is a large standard deductionThe standard deduction reduces a taxpayer’s taxable income by a set amount determined by the government. It was nearly doubled for all classes of filers by the 2017 Tax Cuts and Jobs Act (TCJA) as an incentive for taxpayers not to itemize deductions when filing their federal income taxes. or zero bracket (up to $50,000 for married couples) and then the brackets only move up relatively slowly even after that threshold is reached. For illustrative purposes, we’ve created a chart of the tax burden for a married couple, considering only the bracket structures and the standard deduction. We kept it to these two key elements because they are the most important aspects of a personal income tax system, and they are also the elements for which the Trump plan most differs from current law. On a real-life tax return, these couples might claim some above-the-line deductions, or they might have children and claim them as dependents, and so on.
Looking at this chart, it’s clear what an important tax cut Mr. Trump’s bracket structure is. Most married couples in America have an income level that puts them somewhere on the X axis of this chart—and for every possible income level, the Trump bracket structure results in a much lower tax burden. This is a big story, and one that deserves more coverage; a tax plan should not be measured purely by what it does to or for the wealthiest.
However, it’s also clear from this chart that the Trump plan has no chance of sustaining current-law revenue levels (or potentially increasing them, as Mr. Trump has claimed.) The area on this chart between the line representing the Trump plan and the line representing current law—an area that represents the tax cuts over the whole middle-class income distribution—is quite large. In order to get a precise revenue estimate, you’d weight each income level by the number of filers at that income level and sum it all up, and in fact, this is exactly what the Taxes and Growth Model does.
In sum, I continue to believe that the Trump tax plan (as outlined so far) is a very large tax cut for Americans at almost every income level, and therefore, it would reduce federal revenues.
To the Trump campaign: I would ask them to explain further the specific ways in which their plan actually increases tax revenue, rather than reducing it. To journalists: I would challenge them to devote more attention to what tax plans—both Mr. Trump’s and others—do for middle-class Americans, and consider when such tax cuts might be good policy.
Share