


Tax Relief for Families in Europe
2 min readBy:Most countries provide tax relief to families with children—typically through targeted taxA tax is a mandatory payment or charge collected by local, state, and national governments from individuals or businesses to cover the costs of general government services, goods, and activities. breaks that lower income taxes. While all European OECD countries provide tax relief for families, its extent varies substantially across countries.
One way to measure targeted tax relief for families is to compare the tax burdens on labor of a family with one earner and two children and a single worker without children, both earning the same pretax income. Larger differences imply more extensive tax relief for families.
The tax burden on labor—or “tax wedgeBroadly speaking, a tax wedge is the difference between the pre-tax price or return and after-tax price or return. For labor income, it is the difference between the total labor costs to the employer and the corresponding net take-home pay of the employee.”—is defined as the difference between an employer’s total labor cost of an employee and the employee’s net disposable income. In other words, it is the sum of income taxes and payroll taxes of a worker earning the average wage in a country, divided by the total labor cost of this worker.
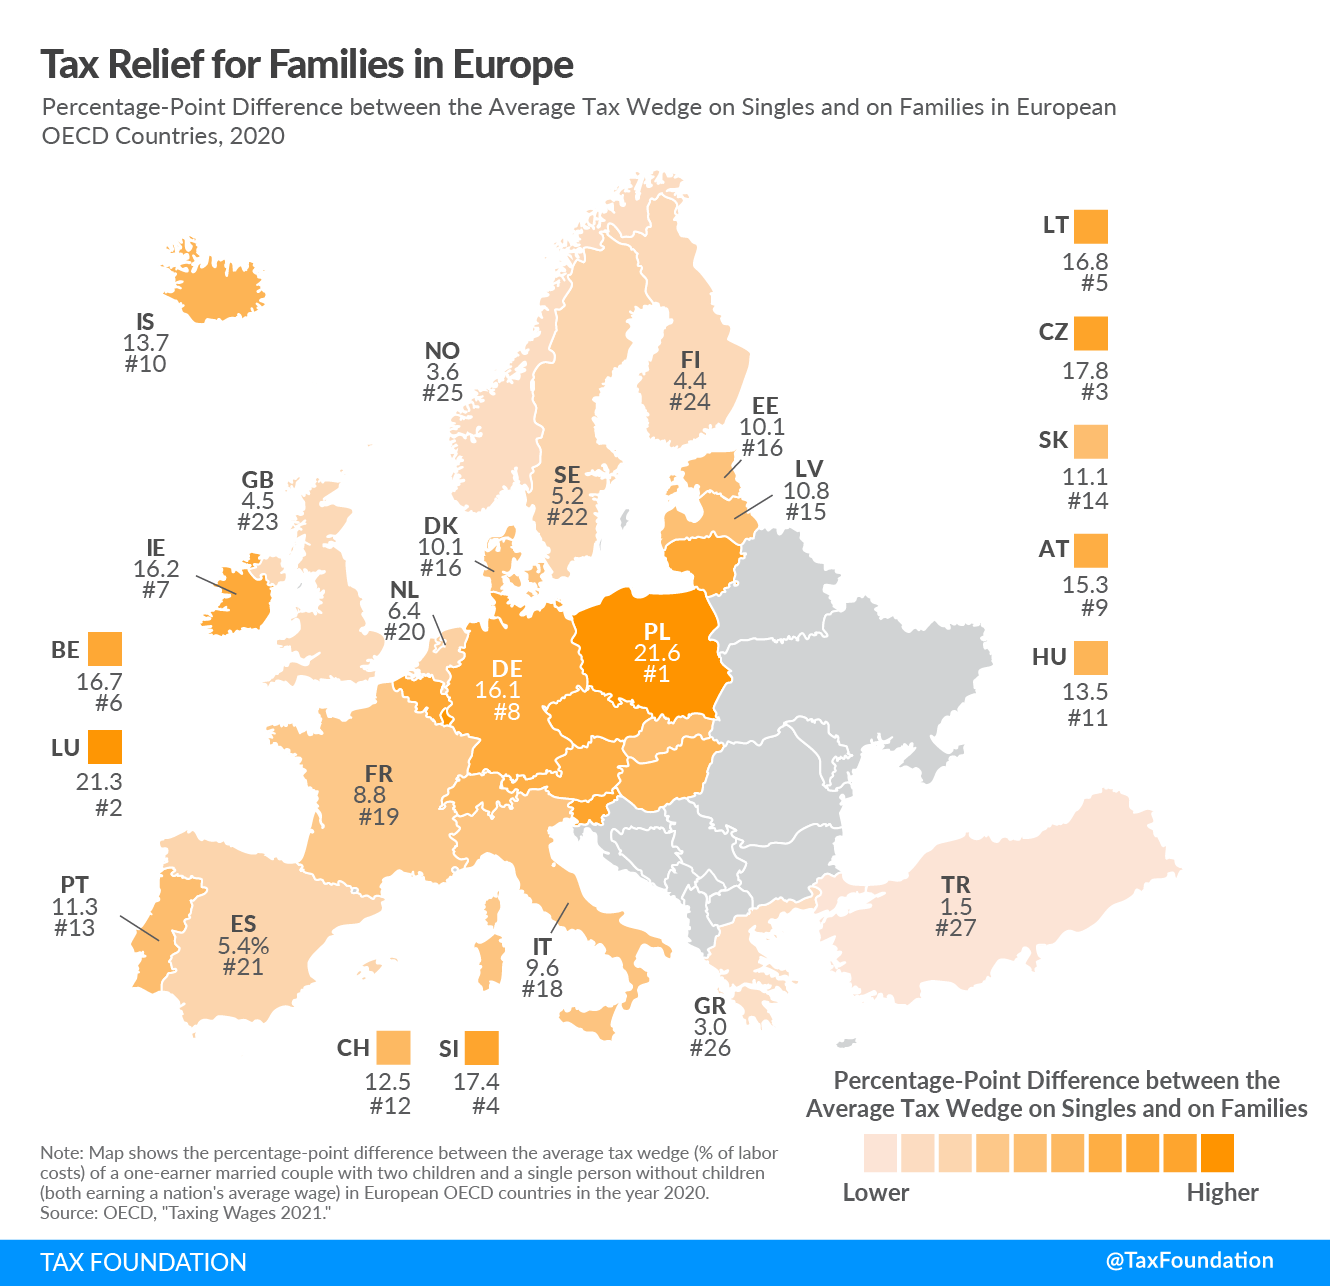
In the European countries covered, a family with one earner and two children faced on average a tax burden of 28.3 percent in 2020. The average tax burden of a single worker without children was 39.6 percent, 11.3 percentage points higher than a family.
Poland had the largest disparity between the two tax wedges of all countries covered, with a 21.6 percentage-point difference between its 13.2 percent tax wedge for families and 34.8 percent tax wedge for single workers.
Turkey had the smallest gap with tax burdens of 38.2 percent on families and 39.7 percent on singles, a difference of only 1.5 percentage points.
| Single person, no children | One-earner married couple, 2 children | Percentage-point difference | |
|---|---|---|---|
| Austria (AT) | 47.3% | 32.0% | -15.3 |
| Belgium (BE) | 51.5% | 34.9% | -16.7 |
| Czech Republic (CZ) | 43.9% | 26.1% | -17.8 |
| Denmark (DK) | 35.2% | 25.1% | -10.1 |
| Estonia (EE) | 36.9% | 26.8% | -10.1 |
| Finland (FI) | 41.2% | 36.7% | -4.4 |
| France (FR) | 46.6% | 37.9% | -8.8 |
| Germany (DE) | 49.0% | 32.9% | -16.1 |
| Greece (GR) | 40.1% | 37.1% | -3.0 |
| Hungary (HU) | 43.6% | 30.1% | -13.5 |
| Iceland (IS) | 32.3% | 18.6% | -13.7 |
| Ireland (IE) | 32.3% | 16.1% | -16.2 |
| Italy (IT) | 46.0% | 36.4% | -9.6 |
| Latvia (LV) | 41.8% | 31.1% | -10.8 |
| Lithuania (LT) | 36.9% | 20.1% | -16.8 |
| Luxembourg (LU) | 37.5% | 16.3% | -21.3 |
| Netherlands (NL) | 36.4% | 30.0% | -6.4 |
| Norway (NO) | 35.8% | 32.2% | -3.6 |
| Poland (PL) | 34.8% | 13.2% | -21.6 |
| Portugal (PT) | 41.3% | 30.0% | -11.3 |
| Slovak Republic (SK) | 41.2% | 30.1% | -11.1 |
| Slovenia (SI) | 42.9% | 25.5% | -17.4 |
| Spain (ES) | 39.3% | 33.9% | -5.4 |
| Sweden (SE) | 42.7% | 37.5% | -5.2 |
| Switzerland (CH) | 22.1% | 9.6% | -12.5 |
| Turkey (TR) | 39.7% | 38.2% | -1.5 |
| United Kingdom (GB) | 30.8% | 26.4% | -4.5 |
| Average | 39.6% | 28.3% | -11.3 |
|
Source: OECD, “Taxing Wages,” April 2021, https://stats.oecd.org/Index.aspx?DataSetCode=AWCOMP#. |
|||
Stay informed on the tax policies impacting you.
Subscribe to our free newsletter to get the latest tax data, news and analysis.
SubscribeAbout the Author

Elke Asen
Policy Analyst
Elke Asen was a Policy Analyst with the Tax Foundation’s Center for Global Tax Policy, focusing on international tax issues and tax policy in Europe. Prior to joining the Tax Foundation, Elke interned with the EU Delegation in Washington, D.C., the German Development Agency, and a social startup in Munich, Germany. She holds a BS in Economics from Ludwig Maximilian University of Munich.