Last week, the Center on Budget and Policy Priorities (CBPP) released a critique of the TaxA tax is a mandatory payment or charge collected by local, state, and national governments from individuals or businesses to cover the costs of general government services, goods, and activities. Foundation’s Taxes and Growth (TAG) Macroeconomic Model. Most of the authors’ comments center around the fact that our macroeconomic results differ, sometimes significantly, from those offered by both the Congressional Budget Office (CBO) and the Joint Committee on Taxation (JCT). As such, we think it would be useful to respond by explaining how our model differs and why we make the assumptions that we do. This will make it easier to understand why we, CBO, and JCT often show divergent results.
The Big Difference Among Our Models: How Much Saving is Available?
There are a number of similarities and differences between our model and those employed by JCT and CBO. For example, both the JCT’s “Macroeconomic Growth” (MEG) model and our TAG model are based on neoclassical production functions that estimate the long-run size of the economy as a function of labor and capital. JCT’s “Overlapping Generations” (OLG) model is much different than ours in that it takes into consideration a number of demographic factors and requires budget deficits to “close” in the long run.
While one could itemize every single difference between our models, I think it is best to focus on, in my mind, the most significant one. This difference stems from the question: how open is the U.S. economy to foreign financial flows and how much saving is available to fund new investment?
The JCT and CBO believe that, while the U.S. is an open economy, there is a limited amount of saving available to the United States to fund new investment opportunities when taxes on investment are reduced. This assumption means that when taxes are cut and the federal budget deficit increases, the amount of available saving for private investment is “crowded-out” by government borrowing. This drives up interest rates and reduces the long-run size of the U.S. economy.
In contrast, we believe there is more saving available to the United States, either from increased saving domestically or from inbound saving from abroad. As such, when taxes on investment are cut and budget deficits are modestly increased, there is enough available saving to both fund new investment and lend to the government. Interest rates would not increase nor would we see crowd-out that would reduce the long-run size of the economy.
In a recent paper, my colleague Alan Cole lays out why we are skeptical of the assumption used by JCT and CBO. He points out that while empirical work has found evidence of crowd-out in the past, the estimated impact is usually small and sensitive to econometric techniques. Most recently, the study of the phenomenon has fallen out of style. Rather, most analysis is instead focused on why interest rates remain so low and why we haven’t seen a significant relationship between higher budget deficits and higher interest rates.
One of the reasons why this may be the case is that the amount of available saving throughout the world has greatly increased. Ben Bernanke has written many times about what he calls the “global savings glut,” which he says helps “explain both the increase in the U.S. current account deficit and the relatively low level of long-term real interest rates in the world today.”
In addition, world capital markets are more interconnected than they used to be. This fact has led Jared Bernstein, former chief economist for Vice President Joe Biden and current senior fellow at CBPP, to also express considerable skepticism that increasing deficits will lead to a significant crowding-out effect. In a blog post in 2014, he wrote: “the evidence for lower deficits leading to lower interest rates is surprisingly weak.” He has also pointed out that the CBO’s forecasts that have predicted rising interest rates have been off the mark for a number of years. (One wonders if there is an internal debate about this issue over at CBPP.)
Our Results in Context
With this context, the difference between the estimates from our model and those employed by JCT and CBO make sense. For example, CBPP cites our estimate that enacting permanent bonus expensing would grow the economy by 1.1 percent and compares it to JCT’s estimate that it would grow the economy by only 0.2 percent. That is a big difference, but a lot of it stems from the JCT believing that even in the presence of trillions in global savings, an increase in the federal budget deficit of a little more than $200 billion over a decade (and much less in subsequent decades) is enough to raise interest rates and depress domestic capital investment. We do not believe that this would be the case.
While we tend to show larger effects than JCT and CBO in some cases, we show similar results in others. Our estimate of the economic impact of Former Ways and Means Chairman David Camp’s tax reform proposal was very similar to JCT’s MEG model estimates. They found the plan would grow the size of the economy by between 0.2 percent.
It is also worth noting that there are other mainstream economic models that produce even greater results than we do. One prominent example is from Laurence J. Kotlikoff and others in the NBER paper “Simulating the Elimination of the U.S. Corporate Income Tax.” They found that if the U.S. were to eliminate the corporate income taxA corporate income tax (CIT) is levied by federal and state governments on business profits. Many companies are not subject to the CIT because they are taxed as pass-through businesses, with income reportable under the individual income tax. and replace the revenue with a consumption taxA consumption tax is typically levied on the purchase of goods or services and is paid directly or indirectly by the consumer in the form of retail sales taxes, excise taxes, tariffs, value-added taxes (VAT), or an income tax where all savings is tax-deductible. , it would boost the level of GDP by 8 percent. We ran a similar proposal for our book, Options for Reforming America’s Tax Code. We found that replacing the corporate income tax with a consumption-based tax would increase the level of GDP by 5.5 percent.
Does the Saving Come from Home or Abroad?
CBPP also notes that we do not separate the additional income from economic growth into the share remaining with Americans and the share going to foreigners over the adjustment period. This is a legitimate observation. It would affect to a modest degree the revenue estimates over the budget period, and the rise in incomes of U.S. residents during that time. We are working to develop a more precise estimate of this effect during the adjustment window. Nonetheless, the effect is primarily a transition issue and is unlikely to be large in the long run. It should not affect our reported long-run increase in U.S. incomes.
If an increase in the capital inflow occurs to help finance an economic expansion, it may or may not increase future outbound interest or dividend payments. For instance, if the net capital inflow is due to more U.S. saving remaining at home, the additional dividends or interest will accrue to U.S. residents. If, as may well be the case, there is additional investment in the U.S. by foreign savers, some will flow abroad.
Investment comes before the income gains associated with it. If the initial surge in investment in the U.S. increases faster than U.S. saving, then the expansion would be funded disproportionally by foreign money entering the U.S. At first, it would result in a rising share of capital income going to foreign savers. However, as the capital is put in place here, and U.S. employment and wages rise over time, U.S. saving would be expected to increase. The additional saving might buy back some of the foreign-held U.S. assets, or be used to acquire more foreign assets. Either way, the eventual rise in U.S. incomes would be as we calculate.
Improving our Ten-Year Dynamic Results
Another minor critique from CBPP centers around our ten-year dynamic budget forecasts. They correctly state that the core of our current model is what is called a “comparative statics” model. In other words, the model shows what today’s economy would have looked like if an alternative tax policy had always been in place. In order to convert this analysis into a ten-year budget score, we assume that the adjustment—how long it takes to get from where we are now to the new level estimated by the model—takes about ten years. We also make a number of adjustments to our results if policy changes result in significant transitional issues.
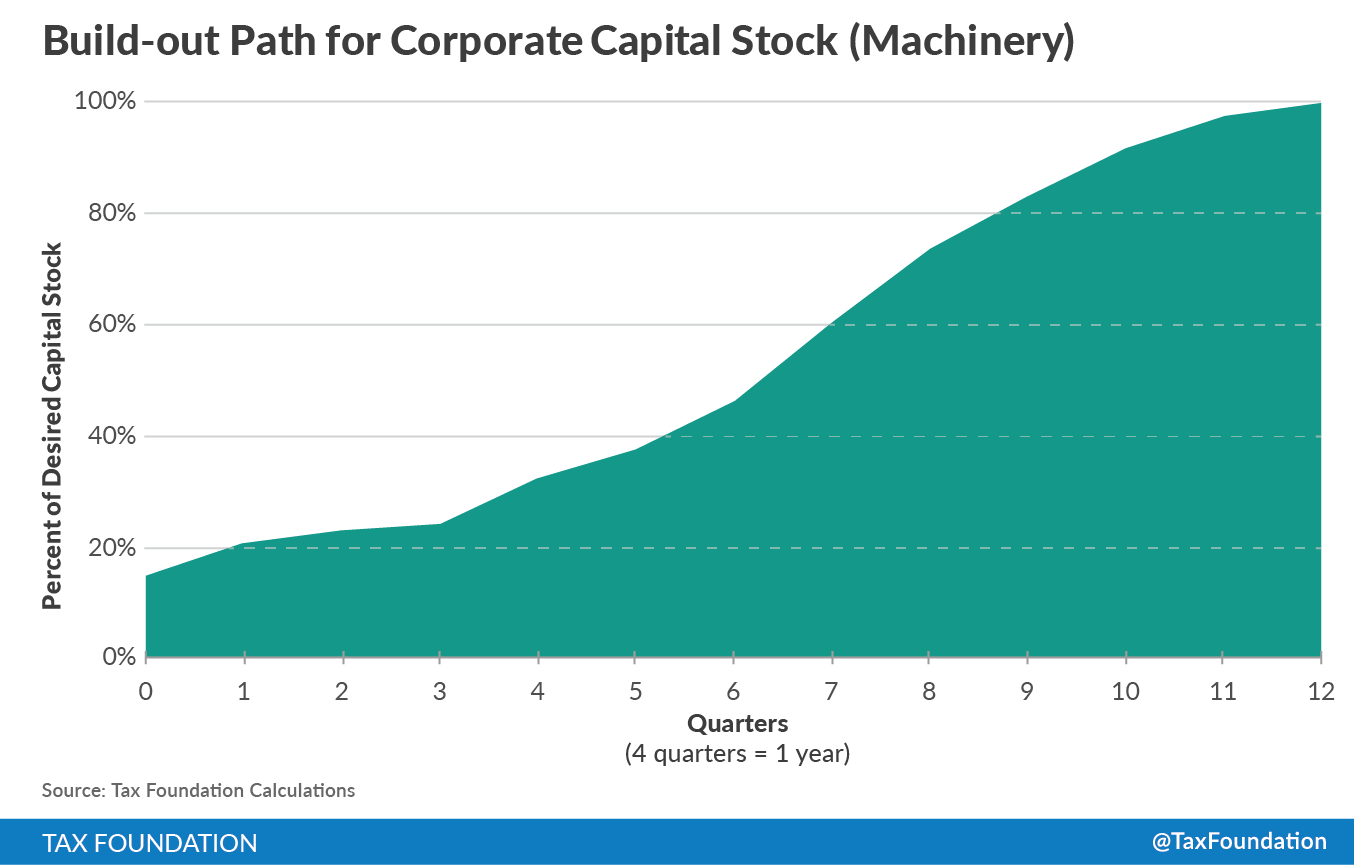
The path we estimate does not perfectly capture the adjustment and we currently are working on improving this aspect of the model. In a later version of the model, we will estimate the adjustment path for the build-out of each type of capital separately. The build-out path will be estimated based on historical data. Below is an illustration based on initial estimates of the build-out path for machinery. The chart shows that it takes approximately three years for the stock of machinery to adjust to a change in the cost of capital, but the path is uneven.
Conclusion
We believe that using dynamic scoring to fully analyze the impacts of tax policy on the economy, taxpayers, and the federal government is important. This is why we put together this model and it is why we are constantly improving it. A vital part of the process of improving dynamic scoringDynamic scoring estimates the effect of tax changes on key economic factors, such as jobs, wages, investment, federal revenue, and GDP. It is a tool policymakers can use to differentiate between tax changes that look similar using conventional scoring but have vastly different effects on economic growth. is an open discussion about the assumptions and data that go into any model, whether it is ours, CBO’s, or JCT’s. We appreciate the comments from the Center on Budget and Policy Priorities and hope that they continue this dialogue with us as we continue to make improvements to our model.
Share this article