Note: An updated version of this study, “TaxA tax is a mandatory payment or charge collected by local, state, and national governments from individuals or businesses to cover the costs of general government services, goods, and activities. Gouging at the Pump,” April 2, 2008, can be found at here.
High gas prices and strong oil company earnings have generated a rash of new tax proposals in recent months. Some lawmakers have called for new “windfall profits” taxes—similar to the one signed into federal law in 1980 by President Jimmy Carter—that would tax the profits of major oil companies at a rate of 50 percent. Meanwhile, many commentators have voiced support for the idea of increasing gas taxes to keep the price of gasoline at post-Katrina highs, thereby reducing gas consumption.
However, often ignored in this debate is the fact that oil industry profits are highly cyclical, making them just as prone to “busts” as to “booms.” Additionally, tax collections on the production and import of gasoline by state and federal governments are already near historic highs. In fact, in recent decades governments have collected far more revenue from gasoline taxes than the largest U.S. oil companies have collectively earned in domestic profits. (Click here for previous analysis of state, local and federal gas taxes.)
According to data compiled by the U.S. Department of Energy’s Energy Information Administration, the domestic profits of the 25 largest oil companies in the U.S. have been highly volatile since the late 1970s.
As illustrated in Figure 1, between 1977 and 1985, the oil industry recorded relatively high profits—averaging nearly $33 billion per year, after adjusting for inflationInflation is when the general price of goods and services increases across the economy, reducing the purchasing power of a currency and the value of certain assets. The same paycheck covers less goods, services, and bills. It is sometimes referred to as a “hidden tax,” as it leaves taxpayers less well-off due to higher costs and “bracket creep,” while increasing the government’s spending power. . These good times were followed by ten years of relatively flat profits, averaging just $12.3 billion per year. In 1996, profits began to rise again but have been anything but stable, ranging from $9 billion to nearly $42 billion per year. Between 1977 and 2004, the industry’s domestic profits totaled $643 billion, after adjusting for inflation.
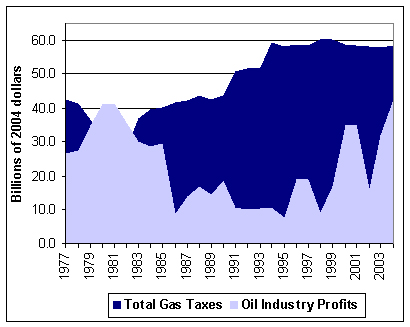
Source: Bureau of Economic Analysis, U.S. Energy Information Administration
In contrast, federal and state taxes on gasoline production and imports have been climbing steadily since the late 1970s and now total roughly $58.4 billion. Due in part to substantial hikes in the federal gasoline excise taxAn excise tax is a tax imposed on a specific good or activity. Excise taxes are commonly levied on cigarettes, alcoholic beverages, soda, gasoline, insurance premiums, amusement activities, and betting, and typically make up a relatively small and volatile portion of state and local and, to a lesser extent, federal tax collections. in 1983, 1990, and 1993, annual tax revenues have continued to grow. Since 1977, governments collected more than $1.34 trillion, after adjusting for inflation, in gasoline tax revenues—more than twice the amount of domestic profits earned by major U.S. oil companies during the same period.
As illustrated in Table 1, since 1977, there have been only three years (1980, 1981, and 1982) in which domestic oil industry profits exceeded government gas taxA gas tax is commonly used to describe the variety of taxes levied on gasoline at both the federal and state levels, to provide funds for highway repair and maintenance, as well as for other government infrastructure projects. These taxes are levied in a few ways, including per-gallon excise taxes, excise taxes imposed on wholesalers, and general sales taxes that apply to the purchase of gasoline. collections. In the remaining years, gasoline tax collections consistently exceeded oil industry profits, reaching a peak in 1995 when gas tax collections outpaced industry profits by a factor of 7.3.
| Year | Oil Profits | Federal Taxes | State Taxes | Total Taxes |
|---|---|---|---|---|
| 1977 | $26.8 | $13.7 | $29.0 | $42.7 |
| 1978 | $27.5 | $13.0 | $28.1 | $41.1 |
| 1979 | $34.9 | $11.4 | $25.2 | $36.7 |
| 1980 | $41.0 | $9.4 | $22.0 | $31.4 |
| 1981 | $41.4 | $8.5 | $21.0 | $29.5 |
| 1982 | $35.8 | $8.0 | $20.6 | $28.6 |
| 1983 | $30.2 | $15.0 | $22.0 | $37.0 |
| 1984 | $28.7 | $16.2 | $23.5 | $39.6 |
| 1985 | $29.3 | $15.6 | $24.6 | $40.2 |
| 1986 | $9.0 | $15.9 | $25.7 | $41.5 |
| 1987 | $14.0 | $15.0 | $27.4 | $42.4 |
| 1988 | $16.9 | $15.6 | $28.1 | $43.8 |
| 1989 | $14.5 | $14.5 | $28.3 | $42.8 |
| 1990 | $18.6 | $14.5 | $29.1 | $43.5 |
| 1991 | $11.0 | $21.1 | $29.7 | $50.8 |
| 1992 | $10.1 | $20.9 | $30.8 | $51.7 |
| 1993 | $10.6 | $20.9 | $31.4 | $52.3 |
| 1994 | $10.8 | $27.1 | $32.1 | $59.3 |
| 1995 | $7.9 | $26.3 | $31.9 | $58.1 |
| 1996 | $18.9 | $26.8 | $32.0 | $58.9 |
| 1997 | $18.8 | $26.0 | $32.6 | $58.6 |
| 1998 | $9.0 | $27.1 | $33.1 | $60.3 |
| 1999 | $16.8 | $26.5 | $33.6 | $60.1 |
| 2000 | $34.9 | $25.7 | $33.3 | $59.0 |
| 2001 | $35.1 | $24.9 | $33.6 | $58.5 |
| 2002 | $16.2 | $24.5 | $33.9 | $58.4 |
| 2003 | $31.7 | $24.6 | $33.4 | $58.0 |
| 2004 | $42.6 | $24.2 | $34.2 | $58.4 |
| Total | $643.0 | $533.0 | $810.1 | $1,343.1 |
| Source: Bureau of Economic Analysis, U.S. Energy Information Administration | ||||
Unlike the highly volatile path of industry profits, gasoline taxes exhibit steady growth with little regard for changes in the U.S. economy. As lawmakers respond to rising gas prices, they should keep in mind the importance of state and federal gasoline taxes in comparison with oil industry profits.
Share this article