The Internal Revenue Service (IRS) was one of the biggest winners in the recently enacted Inflation Reduction Act (IRA). The new law approved roughly $80 billion in additional IRS funding over the next 10 years. This will boost the IRS budget from around $12 billion per year to roughly $20 billion, a 66 percent increase.
Throughout the debate over the new IRS funding there have been many questions raised about the IRS’s budget, staffing, and effectiveness. The IRS’s website provides a considerable amount of data to help clarify these issues.
IRS Funding Has Been Flat in Real Terms
Critics make a fair point that IRS funding has seen very little, if any, real growth in many years. As the table below illustrates, after adjusting for inflation the IRS budget has been basically flat for the past two decades. The IRS budget was $13.7 billion in 2021. In inflationInflation is when the general price of goods and services increases across the economy, reducing the purchasing power of a currency and the value of certain assets. The same paycheck covers less goods, services, and bills. It is sometimes referred to as a “hidden tax,” as it leaves taxpayers less well-off due to higher costs and “bracket creep,” while increasing the government’s spending power. -adjusted terms, this is roughly the same level it was in 2012 and 2002. Meanwhile, the U.S. population has grown by 7 percent since 2010 and 17 percent since 2000. Funding has certainly not grown as the population has grown.
IRS Staffing Has Dropped Dramatically
As the table below illustrates, thirty years ago, the IRS employed more than 114,000 full-time equivalent (FTE) personnel. By 2000, the number of FTEs had dropped to just over 97,000, a decline of about 17 percent. The decline continued gradually over the next fifteen years but has accelerated quickly since 2015. Today, the number of FTEs at the IRS stands at roughly 78,000. This represents a drop of 36,000 FTEs compared to 1991, or 32 percent.
The IRS Has Been Investing in Technology
Although there have been numerous news stories about the computer systems at the IRS that run on 1960 operating systems, and the fact they still have to enter paper returns by hand into those systems, the IRS has spent nearly $11 billion (in 2021 dollars) since 1994 on technology and business system modernization. Roughly half of that total, $5.3 billion, has been spent since the Business System Modernization effort began in earnest in 2006. While this seems like a considerable investment, this modernization funding has only amounted to 3 percent of the IRS budget over the past fifteen years.
Despite this investment in modernization, the IRS is still miles behind the technology curve. In her 2023 Report to Congress, the IRS’s National Taxpayer Advocate (NTA) was quite critical of the IRS for failing to implement scanning technology to digitally input paper taxA tax is a mandatory payment or charge collected by local, state, and national governments from individuals or businesses to cover the costs of general government services, goods, and activities. returns into the computer system. During this filing season, the IRS had a backlog of over 21 million paper returns that had to be keystroked into the computer system by hand. As the NTA wrote in her report, “In the year 2022, that doesn’t just seem crazy. It is crazy.” [Emphasis original]. She strenuously recommended that scanning technology be acquired and implement in time for the 2023 filing season.
Because too many IRS employees are doing menial tasks, such as keystroking paper tax returns, they have too few employees answering the phones. According the NTA report, during the 2022 filing season, the IRS received 73 million phone calls for assistance. An IRS employee answered just 10 percent of those calls, or 7.5 million. Better technology and more customer service employees would certainly help address this problem. But so would a simpler tax code.
The Growth in E-Filing Has Made the IRS’s Job Easier
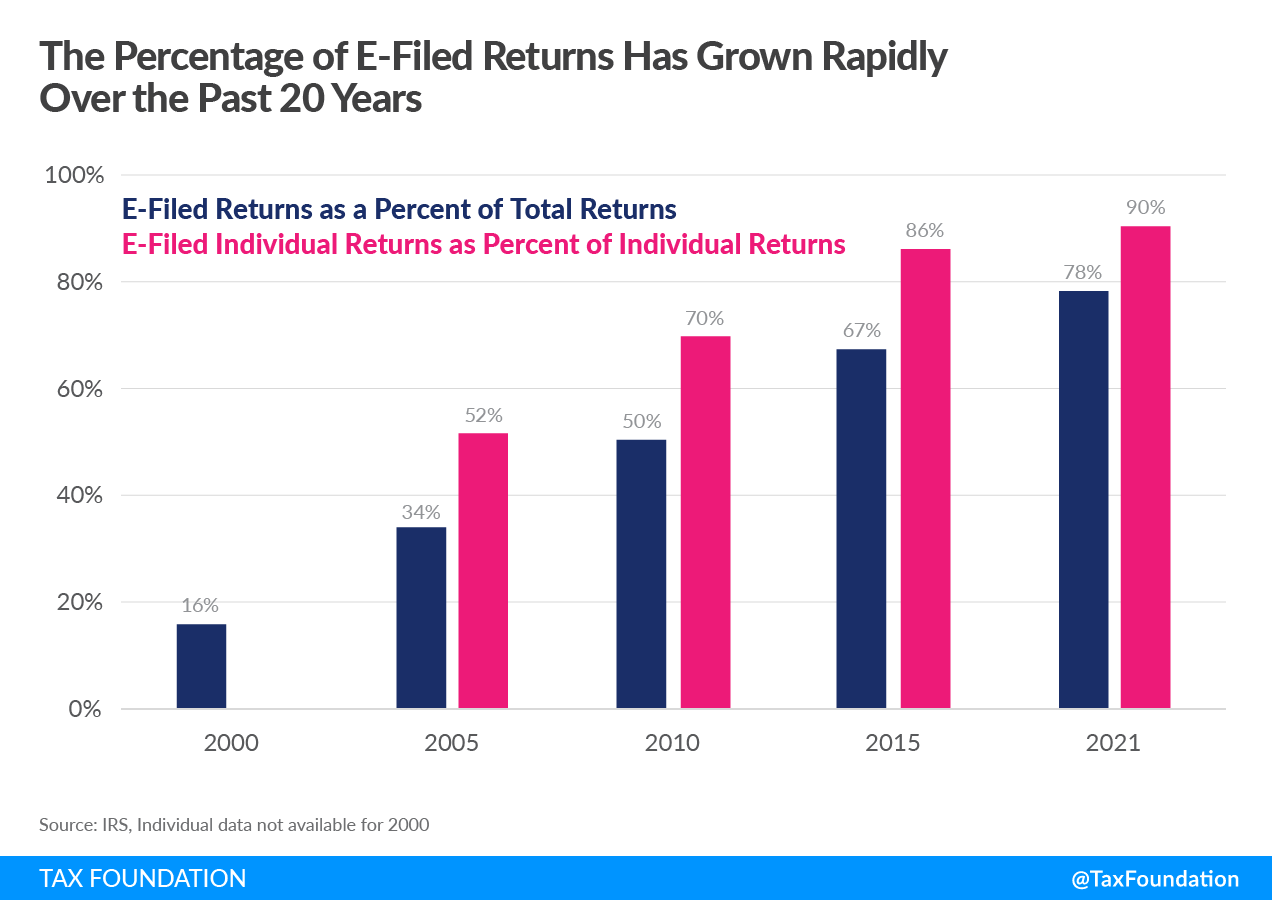
The investment in technology over the past twenty years has facilitated an explosive growth in the number of taxpayers who can file their returns electronically. These are not just income tax returns, but include employment returns, excise tax, estate tax, and non-profit returns. The accompanying chart shows the rapid growth in electronic filing since 2000.
In 2000, just 16 percent of all tax returns were filed electronically. The number of e-filers doubled by 2005 and hit 50 percent by 2010. Today, 78 percent of all tax returned are filed electronically.
The growth in individual e-filers has been even more rapid, no doubt because of the availability of commercial tax preparation software. Although the IRS did not separate individual returns from the total in 2000, we can see that by 2005, more than half of all individual tax returns were e-filed. The number of e-filers grew to 86 percent over the next decade, and now stands at 90 percent.
In many respects, taxpayers are now doing much of the work for the IRS. It was not that long ago that IRS employees would have entered all of these returns by hand into the IRS system. Perhaps that is why the IRS needed 114,000 employees in 1991.
And Technology Has Made the IRS Modestly More Efficient
Technology has changed many things in our everyday lives. We no longer need an operator to make a phone call, nor a bank teller to take cash out of our account. Checkout lines at the grocery store are often faster now because of self-checkout. That means fewer live cashiers too. Similarly, technology and taxpayer prepared e-filing has made the IRS more efficient too.
This means the IRS is raising more tax revenues at less cost. In 1991, as the table below illustrates, it cost the IRS .56 cents to raise $100 in tax revenues. Despite the dramatic decline in IRS staffing and the lack of real growth in the IRS budget, it now costs .33 cents to raise $100. That amounts to a 40 percent increase in productivity.
Such that Taxpayer Burdens are Now Relatively High
While the U.S. population has grown considerably since the 1990s, so too has the overall tax burden, such that on a per capita basis the tax burden has actually grown. Indeed, in 2021, the total amount of taxes collected by the IRS equaled $12,367 per person in America, which is higher than at any time in the last 30 years, and likely the highest ever. In 1991, the per capita tax burden was $8,499 on an inflation adjusted basis, about 30 percent smaller than it is today.
Inflation Reduction Act Gave Too Little to Service Back into the IRS
Clearly, the IRS is doing more with less. Unfortunately, the Inflation Reduction Act has focused more of the $80 billion to enforcement and hiring more auditors rather than programs that make it easier for taxpayers to comply with the code and the IRS to administer it. If, for example, the IRS made use of commercial scanning technology to input paper returns into the system, they could redeploy thousands of people to actually helping taxpayers. In other words, put the “service” back into the IRS.
| Year | IRS Operating Costs (in billions of 2021 dollars) | Cost of collecting $100 (in dollars) | Average tax collected per capita (in 2021 dollars)* | Full-time equivalent IRS positions | Technology and Business System Modernization Costs (in millions of 2021 dollars)** |
|---|---|---|---|---|---|
| 1991 | $11.48 | 0.56 | $8,499 | 114,628 | |
| 1992 | $11.83 | 0.58 | $8,396 | 116,673 | |
| 1993 | $12.44 | 0.60 | $8,450 | 113,460 | |
| 1994 | $12.51 | 0.57 | $8,831 | 110,748 | $1,149.8 |
| 1995 | $12.39 | 0.54 | $9,146 | 112,024 | $1,396.7 |
| 1996 | $11.89 | 0.49 | $9,488 | 106,642 | $1,170.8 |
| 1997 | $11.53 | 0.44 | $10,008 | 101,703 | $394.5 |
| 1998 | $12.07 | 0.43 | $10,619 | 98,037 | $408.2 |
| 1999 | $13.04 | 0.43 | $11,053 | 98,730 | $488.3 |
| 2000 | $12.70 | 0.39 | $11,651 | 97,074 | $342.9 |
| 2001 | $13.13 | 0.41 | $11,385 | 97,707 | $53.7 |
| 2002 | $13.36 | 0.45 | $10,515 | 99,181 | $58.2 |
| 2003 | $13.47 | 0.48 | $9,864 | 98,819 | $72.3 |
| 2004 | $13.62 | 0.48 | $9,840 | 97,597 | $70.2 |
| 2005 | $14.03 | 0.46 | $10,600 | 94,282 | $58.2 |
| 2006 | $13.83 | 0.42 | $11,290 | 91,717 | $289.2 |
| 2007 | $13.65 | 0.40 | $11,617 | 92,017 | $305.4 |
| 2008 | $13.86 | 0.41 | $11,307 | 90,647 | $309.1 |
| 2009 | $14.37 | 0.50 | $9,612 | 92,577 | $280.2 |
| 2010 | $14.90 | 0.53 | $9,388 | 94,711 | $353.4 |
| 2011 | $14.56 | 0.51 | $9,306 | 94,709 | $403.9 |
| 2012 | $13.93 | 0.48 | $9,464 | 90,280 | $414.3 |
| 2013 | $13.21 | 0.41 | $10,478 | 86,974 | $300.2 |
| 2014 | $13.00 | 0.38 | $10,986 | 84,133 | $281.7 |
| 2015 | $12.71 | 0.35 | $11,742 | 79,890 | $276.1 |
| 2016 | $12.98 | 0.35 | $11,623 | 77,924 | $434.1 |
| 2017 | $12.56 | 0.34 | $11,595 | 76,832 | $347.9 |
| 2018 | $12.52 | 0.34 | $11,422 | 73,519 | $267.0 |
| 2019 | $12.38 | 0.33 | $11,484 | 73,554 | $365.5 |
| 2020 | $12.64 | 0.35 | $11,061 | 75,773 | $312.9 |
| 2021 | $13.70 | 0.33 | $12,367 | 78,661 | $347.9 |
|
Source: IRS and author calculations. *Based on total collections from all sources **Tech spending in 2000 includes Y2K funding |
|||||