Rep. Luke Messer’s bill, H.R. 668, that would require the president’s annual budget to include the projected cost of deficits per taxpayer passed the house last week. The bill would require a dollar cost per taxpayer, using individuals who file taxA tax is a mandatory payment or charge collected by local, state, and national governments from individuals or businesses to cover the costs of general government services, goods, and activities. returns as the measure. For fun, we’ll look at the cost per person (every man, woman and child), per tax return, and per taxable tax return.
Using historical data and the most recent CBO Budget and Economic Outlook, we’ll take a look what that number would look like in future years, the additional amount Americans would have had to pay in taxes to cover the deficit at current spending levels, and how the deficit has changed over time.
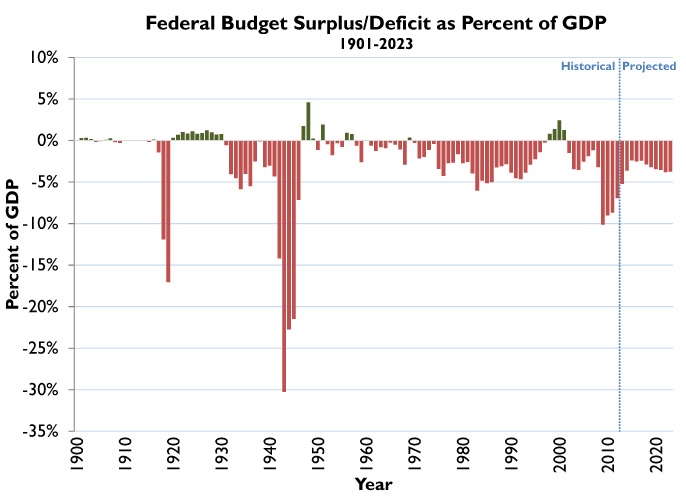
First, a little history: as a percentage of GDP, the graph below shows that with the exception of World War I and II and the Great Depression, the United States’ deficit hovered around 0%, switching between surplus and deficit, until about 1970. From 1971 on, the U.S. experienced an average deficit as a percentage of GDP of 3.1%. Since 2001, our last year of surplus, our average deficit as a percentage of GDP has been 4.7%, with an average of 8.7% over the last four years.
In 2009, the United States’ deficit was 10.1% of GDP. In other words, this means that every American would have had to pay an additional 10.1% of their salary to cover the cost of government – the highest percentage of the average salary in America since 1945 when the deficit was 21.5% of GDP. Over the CBO’s current budget window (2013-2023), we see that ratio drop down to 2.4% in 2017 before it increases each year from 2018 to 2022.
In dollar terms – which the bill uses – the picture looks similar. From 1998 to 2001, the federal government experienced four years of surplus, but from 2002 through the end of the 2023, every year is projected to be in the red (as shown in the Deficit/Surplus Per Person graph below).
When we break this down by cost per person, the greatest the deficit reached was $4,605 per person in 2009. Over the CBO’s current budget window, the deficit would be cut to $1,338 per person in 2015 before increases every year until it reaches $2,864 per person in 2023.

This means to cover the deficit for 2013, every person counted (projected) in the census would need to pay an additional $2,670 a year. If we only consider those who are liable to pay taxes (i.e. exclude nonpayers), every person with a taxable income tax return would need to pay an addition $8,748.03 in federal income taxes to cover the deficit.
By 2023, the tax increase needed to cover the projected levels of spending is projected as $2,864.37 per person, $5,904.43 per tax return, or $9112.17 per taxable tax return. All three comparisons, over the budget window, are shown in the graph below.

Notes: Population projections taken from U.S. Census. Budget and GDP projections taken from CBO and the Office of Budget and Management. Tax Return data taken from IRS. Methodology on tax returns and taxable tax return projections: For total tax return, the projections are a linear extrapolation based available data of total tax returns (1995-2010). For taxable tax return projection, the percent of taxable tax returns compared to total tax returns was taken from 2003 to 2010. The year 2003 is chosen as start year to reflect tax changes beginning in 2003, the majority of which remain in place through the present day.
Share this article