


Changes in the Effective Average Corporate Income Tax Rates in Europe
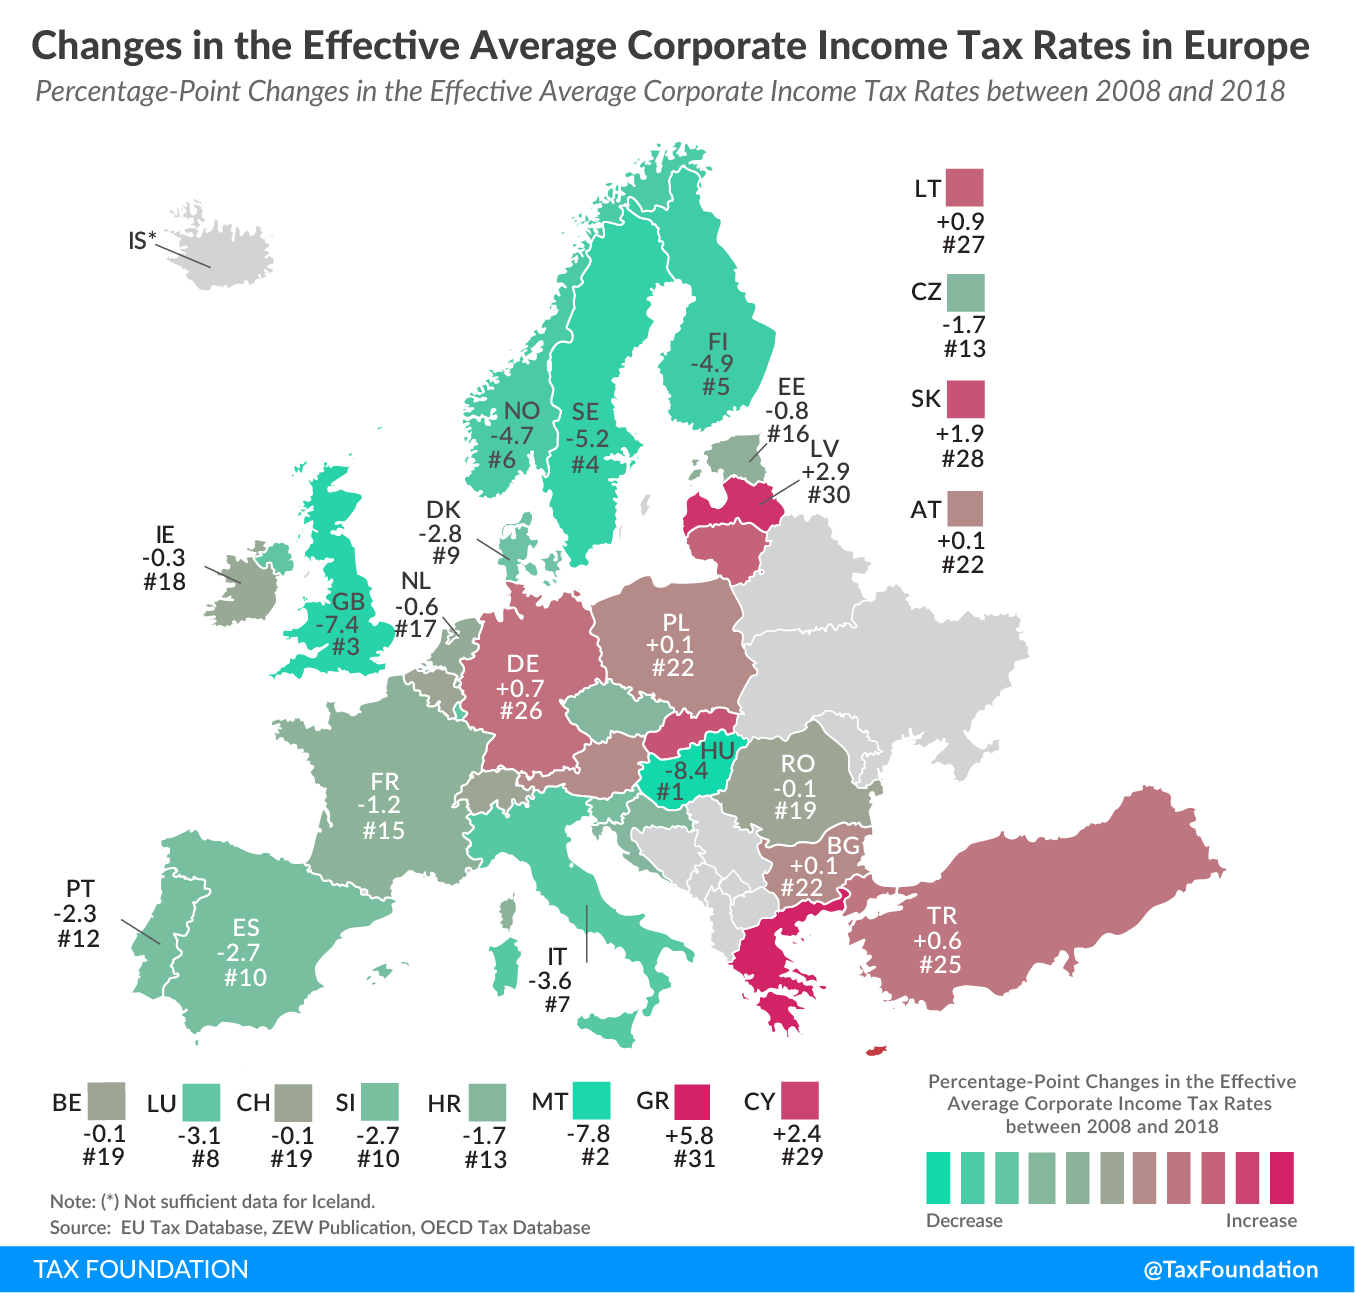
2 min readBy:Effective average corporate income tax rates are informative as they reflect the overall taxA tax is a mandatory payment or charge collected by local, state, and national governments from individuals or businesses to cover the costs of general government services, goods, and activities. burden on businesses, a decisive factor for investment decisions. Today’s map shows how these effective tax rates have changed across Europe between 2008 and 2018.
Effective average corporate income taxA corporate income tax (CIT) is levied by federal and state governments on business profits. Many companies are not subject to the CIT because they are taxed as pass-through businesses, with income reportable under the individual income tax. rates capture not only statutory tax rates but also provisions impacting the tax baseThe tax base is the total amount of income, property, assets, consumption, transactions, or other economic activity subject to taxation by a tax authority. A narrow tax base is non-neutral and inefficient. A broad tax base reduces tax administration costs and allows more revenue to be raised at lower rates.. These include, for example, capital allowances, inventory valuation methods, international tax rules, and the integration of corporate income taxes into individual income taxes.
Taxes make more sense with us in your inbox.
Subscribe to our newsletter for tax insights that cut through the noise—and make sense of it.
Sign UpOf all 31 countries covered, Hungary (-8.4 percentage-points), Malta (-7.8 percentage-points), and the United Kingdom (-7.4 percentage-points) have seen the most significant decreases in the effective corporate income tax rate between 2008 and 2018.
Greece, Latvia, and Cyprus are the countries with the largest increases in the effective tax rates, at 5.8, 2.9, and 2.4 percentage-points, respectively.
On average, the effective tax rate declined by 1.5 percentage-points between 2008 and 2018 in all countries covered, compared to a 1.7 percentage-point decline in the statutory rate.
Much attention has been paid to declining statutory corporate income tax rates. However, as the following table shows, these cuts in statutory tax rates are not always mirrored by changes in effective tax rates. This is because some countries decide to combine a cut in the corporate tax rate with measures adjusting the corporate tax base (such as changing capital allowances or implementing patent boxes).
|
Sources: EU Tax Database, ZEW Publication, OECD Tax Database |
||||||
| Effective Average Corporate Income Tax Rate | Statutory Corporate Income Tax Rate | |||||
|---|---|---|---|---|---|---|
| 2008 | 2018 | Percentage-Point Difference 2008 and 2018 | 2008 | 2018 | Percentage-Point Difference 2008 and 2018 | |
| Austria (AT) | 23.0% | 23.1% | 0.1 | 25.0% | 25.0% | 0.0 |
| Belgium (BE) | 24.9% | 24.8% | -0.1 | 34.0% | 29.6% | -4.4 |
| Bulgaria (BG) | 8.9% | 9.0% | 0.1 | 10.0% | 10.0% | 0.0 |
| Croatia (HR) | 16.5% | 14.8% | -1.7 | 20.0% | 18.0% | -2.0 |
| Cyprus (CY) | 10.6% | 13.0% | 2.4 | 10.0% | 12.5% | 2.5 |
| Czech Republic (CZ) | 18.4% | 16.7% | -1.7 | 21.0% | 19.0% | -2.0 |
| Denmark (DK) | 22.6% | 19.8% | -2.8 | 25.0% | 22.0% | -3.0 |
| Estonia (EE) | 16.5% | 15.7% | -0.8 | 21.0% | 20.0% | -1.0 |
| Finland (FI) | 24.5% | 19.6% | -4.9 | 26.0% | 20.0% | -6.0 |
| France (FR) | 34.6% | 33.4% | -1.2 | 34.4% | 34.4% | 0.0 |
| Germany (DE) | 28.2% | 28.9% | 0.7 | 29.4% | 29.9% | 0.5 |
| Greece (GR) | 21.8% | 27.6% | 5.8 | 35.0% | 29.0% | -6.0 |
| Hungary (HU) | 19.5% | 11.1% | -8.4 | 21.3% | 10.8% | -10.5 |
| Ireland (IE) | 14.4% | 14.1% | -0.3 | 12.5% | 12.5% | 0.0 |
| Italy (IT) | 27.3% | 23.7% | -3.6 | 31.4% | 27.8% | -3.6 |
| Latvia (LV) | 13.8% | 16.7% | 2.9 | 15.0% | 20.0% | 5.0 |
| Lithuania (LT) | 12.7% | 13.6% | 0.9 | 15.0% | 15.0% | 0.0 |
| Luxembourg (LU) | 25.9% | 22.8% | -3.1 | 29.6% | 26.0% | -3.6 |
| Malta (MT) | 32.2% | 24.4% | -7.8 | 35.0% | 35.0% | 0.0 |
| Netherlands (NL) | 23.1% | 22.5% | -0.6 | 25.5% | 25.0% | -0.5 |
| Norway (NO) | 26.5% | 21.8% | -4.7 | 28.0% | 23.0% | -5.0 |
| Poland (PL) | 17.4% | 17.5% | 0.1 | 19.0% | 19.0% | 0.0 |
| Portugal (PT) | 23.7% | 21.4% | -2.3 | 26.5% | 31.5% | 5.0 |
| Romania (RO) | 14.8% | 14.7% | -0.1 | 16.0% | 16.0% | 0.0 |
| Slovakia (SK) | 16.8% | 18.7% | 1.9 | 19.0% | 21.0% | 2.0 |
| Slovenia (SI) | 20.0% | 17.3% | -2.7 | 22.0% | 19.0% | -3.0 |
| Spain (ES) | 32.8% | 30.1% | -2.7 | 30.0% | 25.0% | -5.0 |
| Sweden (SE) | 24.6% | 19.4% | -5.2 | 28.0% | 22.0% | -6.0 |
| Switzerland (CH) | 18.7% | 18.6% | -0.1 | 21.2% | 21.2% | -0.0 |
| Turkey (TR) | 18.6% | 19.2% | 0.6 | 20.0% | 22.0% | 2.0 |
| United Kingdom (GB) | 28.0% | 20.6% | -7.4 | 28.0% | 19.0% | -9.0 |
| Simple Average | 21.3% | 19.8% | -1.5 | 23.7% | 21.9% | -1.7 |
In the United Kingdom, for example, the corporate tax rate was cut from 28 percent in 2008 to 19 percent by 2018, a 9 percentage-point decrease. The effective tax rate, however, only declined by 7.4 percentage-points, from 28 percent to 20.6 percent. This discrepancy is partially because the UK broadened its corporate tax base by lowering capital allowances for machinery and industrial buildings, partly offsetting the tax savings from the tax rate cut.
As this example shows, not only changes in statutory tax rates but also measures adjusting the tax base impact the tax burden businesses face. Effective tax rates reflect both and can thus be a more informative measure when analyzing corporate tax reforms.
Taxes make more sense with us in your inbox.
Subscribe to our newsletter for tax insights that cut through the noise—and make sense of it.
Sign UpAbout the Author

Elke Asen
Policy Analyst
Elke Asen was a Policy Analyst with the Tax Foundation’s Center for Global Tax Policy, focusing on international tax issues and tax policy in Europe. Prior to joining the Tax Foundation, Elke interned with the EU Delegation in Washington, D.C., the German Development Agency, and a social startup in Munich, Germany. She holds a BS in Economics from Ludwig Maximilian University of Munich.