Today, the U.S. Bureau of Economic Analysis released its second estimate of Q2 Gross Domestic Product. But the way economists talk about the economy can sometimes muddle the underlying story. This is especially true when talking about how big the economy is, how fast it grows, and why. To bring these concepts to life, let’s consider a smaller-sized example, say, the economy of a Tax Foundation analyst.
If we wanted to measure how much output a TaxA tax is a mandatory payment or charge collected by local, state, and national governments from individuals or businesses to cover the costs of general government services, goods, and activities. Foundation analyst–let’s call her E–produces, we could count all the blogs and research papers E writes and the number of reporters E talks to. This would be a simple math problem:
E’s Work Output = Blogs + Papers + Interviews
Suppose in E’s first year at Tax Foundation, she writes 50 blogs and 15 research papers and completes 35 interviews. E’s output is 100 units of work (using the simplifying assumption that a blog, a paper, and an interview equal the same amount of work).
Now imagine in the next year, she writes 65 blogs and 15 research papers, and completes 35 interviews. Her output in Year 2 is 115 units of work.
What can we learn about E from this arithmetic?
We know that blogs make up most of her output, and blogs account for all the difference in her output between Year 1 and Year 2. But saying “E’s output growth is driven by blogs” wouldn’t be completely accurate. This arithmetic doesn’t explain why E was able to produce more in Year 2; it simply notes the fact that she did.
If we want to learn why E’s output increased, there’s a different story we need to consider, and that’s the story of her production function. This math problem is more involved than simply adding up things. Instead, it considers factors like education, experience, the number of hours worked, and the tools available to complete the work. It might look something like this:
E’s Work Output = Education x Experience x Hours Worked x Tools
These are E’s factors of production. If E worked more hours in her second year, that could explain why she produced more blogs. If she had better tools to work with, maybe a faster computer or an additional monitor, that could also increase her output. Other things, such as attending training and gaining more experience, are likely to help E increase her output. So, exploring changes in these factors would offer a more accurate story of why E’s output grew from Year 1 to Year 2.
We can also think about the marginal benefit of E’s factors of production. For example, a second or third computer screen might help E produce more, but a fourth, fifth, or sixth might cost more than any benefit it provides. Likewise, if E worked nine hours a day instead of eight, she might be more productive; but if she tried working 15 hours a day, this could tank her productivity. Economists call this concept diminishing marginal returns—a decrease in the additional output provided by an additional input.
Taxes make more sense with us in your inbox.
Subscribe to our newsletter for tax insights that cut through the noise—and make sense of it.
Sign UpBack to these two equations. They can scale up to measure the entire size of the economy.
The first resembles the equation for Gross Domestic Product (GDP), which measures the value of all final goods and services made in the U.S. It adds up consumption spending, investment spending, government spending, and net exports (exports minus imports). Just a note: imports are subtracted because GDP measures things produced in the U.S., and imports are foreign-produced. This does not mean imports are bad; it is only an accounting definition. Like the first equation above, GDP simply accounts for things; it does not explain why the economy gets bigger or smaller.
GDP = C + I + G + (X-M)
The second equation, what economists call a Cobb-Douglas production function, tries to explain how we get economic output. It looks a little scary, but it just tells the story that output (Y) is made through a combination of factors including innovations and unknowns (a), labor or work (L), and the tools used, capital (K). The floating 1-α and α represent marginal factor productivity, or how much more output an additional unit of labor (such as another hour worked) or an additional unit of capital (such as another factory) provide.
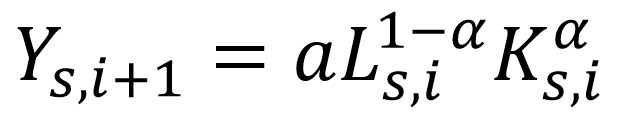
This equation states that economic growth is driven by how much people are willing to work and how much capital (such as machinery, equipment, and factories) people are willing to deploy. Labor and capital are complements; better tools and equipment enable workers to be more productive and increase output, as do technological innovations.
To sum up, it is important to remember what we can and cannot learn from each of these equations. GDP is an accounting identity that shows what was produced and how much. On the other hand, if we want to know what drives economic output, we need to consider the production function.
Share this article