On the heels of a poor jobs report—but another drop in the unemployment rate down to 6.1 percent—Adam Hartung published in Forbes a piece titled “Obama Outperforms Reagan on Jobs, Growth, and Investing.”
In the article, Hartung leads with the unemployment rate as his metric to prove President Obama’s success on the job front as compared to President Reagan.
In the first 67 months of President Obama’s administration, the unemployment rate climbed to 10 percent before falling to 6.1 percent. This is a whole percentage point below Reagan’s 7.1 percent unemployment rate after his first 67 months. But this comparison of job performance misses a couple points.
The Unemployment Rate Fell Faster in the 1980s than Following the Great RecessionA recession is a significant and sustained decline in the economy. Typically, a recession lasts longer than six months, but recovery from a recession can take a few years.
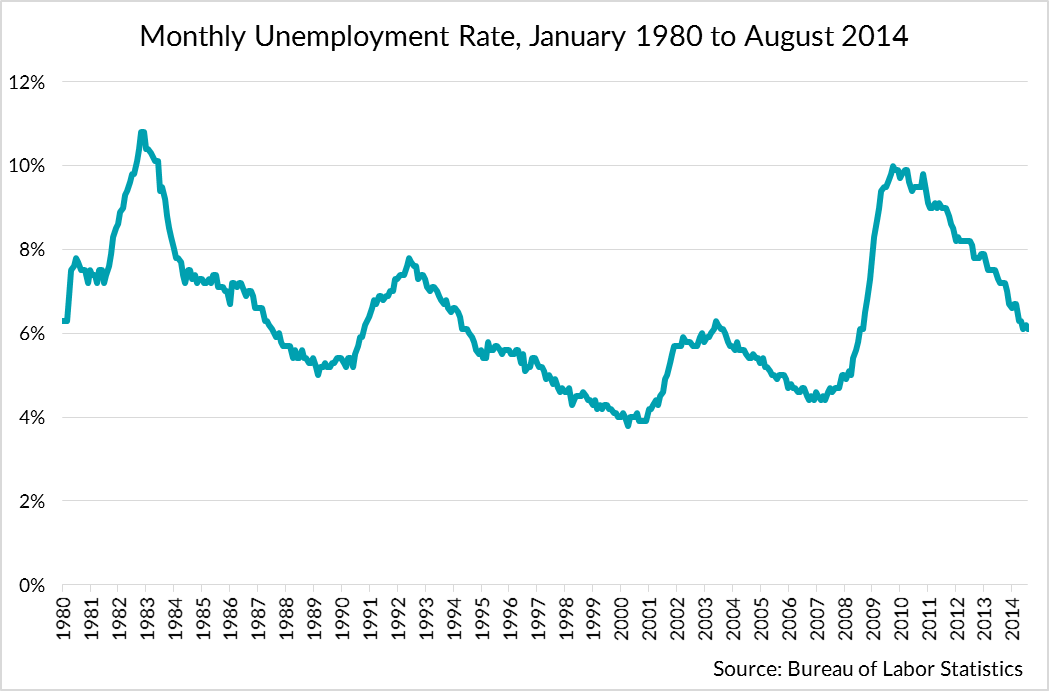
Instead of looking at the first 67 months of each presidency, let’s consider how long it took the unemployment rate to fall to 6.1 percent (the rate for August 2014) following the peak of unemployment. This will give us a better look at how quickly the economies recovered.
In the 1980s, it took a shorter amount of time for the unemployment rate to fall from its peak rate to 6.1 percent. In December of 1982, the unemployment rate reached a peak of 10.8 percent following a year-long recession. In July of 1987 (55 months later), the unemployment rate had dropped to 6.1 percent. Before the end of Reagan’s term, the unemployment rate had fallen to 5.3 percent in December of 1988.
In the post-Great Recession era, the unemployment rate reached its peak of 10 percent in October of 2009. From here, the peak it took 58 months for the unemployment rate to fall to 6.1 percent in August of 2014. (Note: The unemployment rate drop to 6.1 percent in June of this year before increasing to 6.2 percent in July.)
The Unemployment Rate Depends on Demographic Trends
Another factor worth considering is that the unemployment rate is dependent on both the numerator and the denominator.
The labor force participation rate is the share of working age population who are either employed or actively looking for work. Labor force participation is essentially the denominator in the unemployment rate calculation. If we hold the number of unemployed constant, this means that as the labor force participation rate rises, the unemployment rate will rise. Conversely, as the labor force participation rate decreases, the unemployment rate will decrease.
In fact, over the last couple years, we have seen the labor participation rate influence the unemployment rate. From Bloomberg in May (emphasis added):
“The share of the working-age population either employed or seeking a job declined in April for the first time this year, helping drive the unemployment rate down to 6.3 percent, the lowest since September 2008. At 62.8 percent, the so-called participation rate matches the lowest since March 1978.”
In fact, between October 2009 and August of 2014 (the period over which the unemployment rate fell), the labor force participation rate fell from 65 percent to 62.8 percent. This has contributed to the fall in the unemployment rate from 10 percent to 6.1 percent.
It was different story for the 1980s. As Hartung’s own piece shows, from the late 1960s all the way through the 1980s, the labor force participation continuously increased from 59 percent to nearly 67 percent at the start of 1990 (driven by the large number of baby boomers and women entering the work force).
If we look specifically at the 55 months between December of 1982 and July of 1987, the labor participation rate rose from 64.1 percent to 65.5 percent. Yet, all the while, the unemployment rate fell. This means that while the denominator (labor participation) grew, the nominator (employment growth) saw even greater increases.

The Unemployment Rate Doesn’t Tell the Entire Story
In an editorial earlier this year on Real Clear Markets, Nick Eberstadt of AEI makes the case that, while the unemployment rate once was a good way to measure workless in America, it is not nearly as effective today because the work force is different. In Eberstadt’s words:
“The workplace is no longer a men's club — in 2014, fully 47% of the civilian labor force is female. And while being without work still entails hardship, it is no longer the financial disaster and source of shame it once was. In that former America, there was basically no alternative to paid work for able-bodied men; no alternative economically, and no alternative socially. But this is no longer true today. Thanks at least partly to the growth of government support programs, voluntary joblessness – or something close to that – is, increasingly, a viable lifestyle option.”
Eberstadt suggests that there are now three employment statuses in the U.S.: employed, unemployed, and choosing neither to work or look from work. This “flight from work,” as he calls it is clear in the post-recession U.S.
Eberstadt uses a version of the chart below to shows that the civilian employment to population ratio has completely dropped off since the great recession and remained relatively flat between 58 and 59 percent for the last four years.
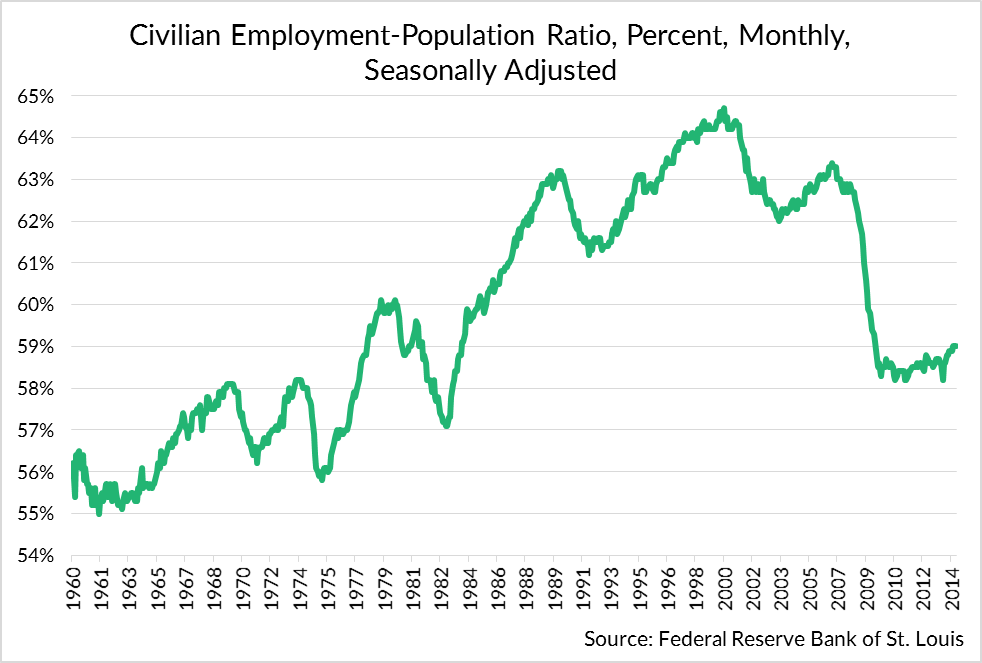
The drop in the unemployment rate to 6.1 percent tells a story that seemingly isn’t true. As discouraged or tired workers drop out of the labor market, the unemployment rate may drop, but this does not demonstrate the health of the labor market.
A falling labor participation rate and a depressed and stagnant employment to population ratio tell a story of long-term unemployment that require structural changes to address.
TaxA tax is a mandatory payment or charge collected by local, state, and national governments from individuals or businesses to cover the costs of general government services, goods, and activities. reform isn’t the only solution, but it should be one them.
Share this article