The HEROES Act, introduced Tuesday by House Democrats, provides more than $1 trillion to state and local governments, including $915 billion in flexible aid—which can be spent for any purpose, including to backfill revenue losses—in installments over the next year. In broad strokes, these coronavirus relief funds are four tranches for allocation purposes: by jurisdiction (i.e., the same amount to each state), by population, by COVID-19 cases, and by unemployment. The jurisdictional and population-based distributions can be thought of as guaranteed; this $667 billion share can be calculated now and will not change. The remaining $248 billion cannot be allocated yet, as it will depend on health and job statistics as of the spring of 2021.
This blog post outlines how this funding is distributed and makes provisional estimates of how much each state (and its local governments) will receive. It should be emphasized that these are preliminary estimates and should be treated as a rough idea of what each state can expect—not as a final calculation. Most payments under the bill are made in two installments, the second of which must be paid out by May 3, 2021.
The U.S. territories (American Samoa, Guam, Northern Mariana Islands, Puerto Rico, and the Virgin Islands) in particular make out well under the bill’s funding formula, with tiny American Samoa receiving an estimated $2.17 billion in aid, worth $42,638 per capita, while the average for U.S. states and the District of Columbia is $1,910 per capita ($1,971 including the $20 billion for tribal governments). Across all U.S. populations, including territories, the average is $2,010.
Within the states, per capita distributions range from $1,562 in Pennsylvania to $5,051 in Wyoming. The District of Columbia, which many felt was shortchanged under the Coronavirus Relief Fund (CRF) in the CARES Act (since it did not receive the $1.25 billion minimum accorded to states), not only receives a gross-up of $755 million under the CRF, but also receives a $4,839 per capita allocation under the proposed state and local fiscal relief packages, higher than in any state other than Wyoming.
We have previously proposed that any state and local government relief package rely more heavily on population-based allocations, and outlined the difficulties associated with the use of health and economic measures, though the HEROES Act’s economic measure, at least, is largely in line with how we suggested such calculations be approached. Notably, the $915 billion price tag on this element of the HEROES Act, and the more than $1 trillion in total resources to states and localities, is significantly larger than existing estimates of state and local revenue losses—not just through next year, but for the full five years anticipated as necessary for government revenues to recover in real terms.
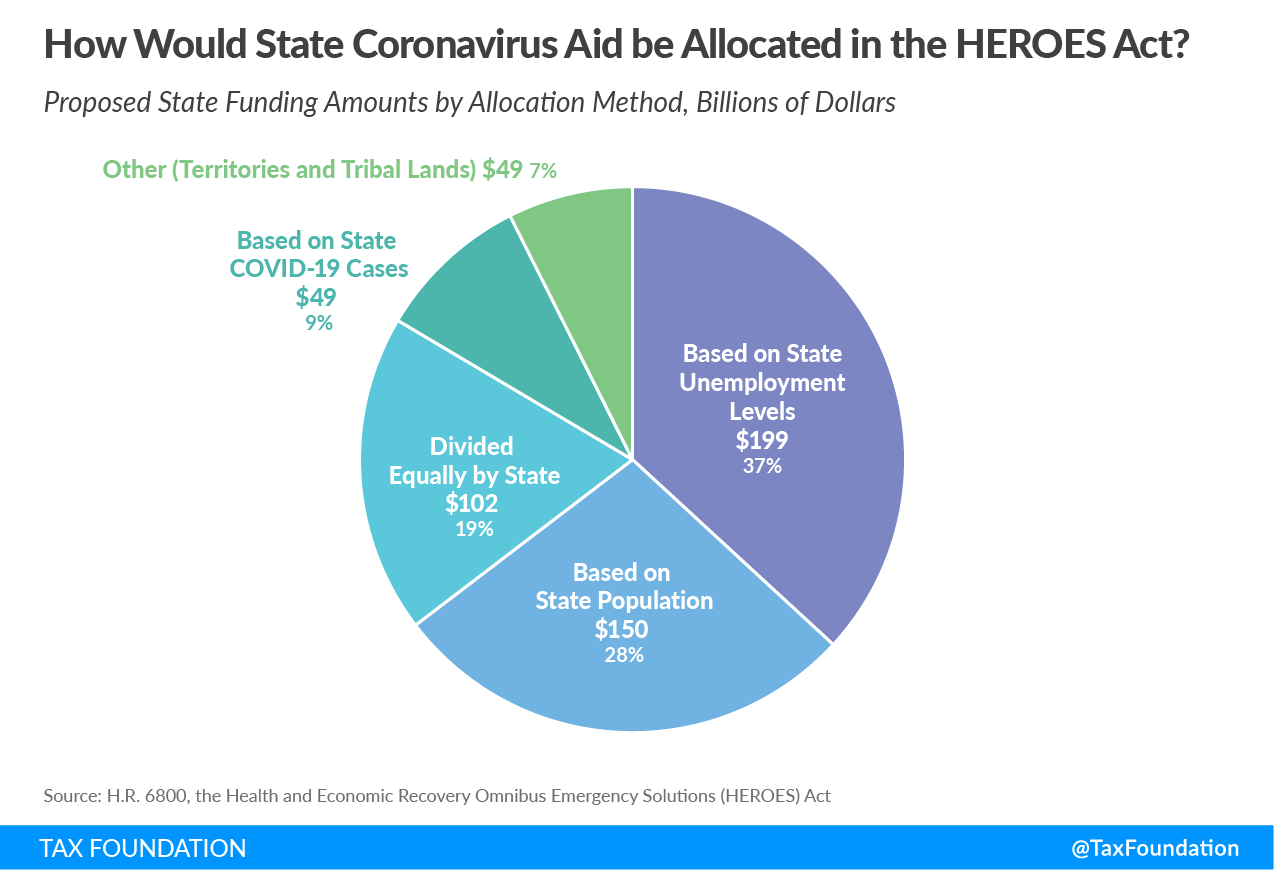
State-Level Funding
States and the District of Columbia divide $500 billion as follows:
- $102 billion in equal payments of $2 billion
- $150 billion divided by population
- $49 billion allocated by share of COVID-19 cases (per data from the CDC, Centers for Disease Control and Prevention)
- $199 billion based on unemployment as of the first quarter of 2021
Separately, territories receive $20 billion, half in equal $2 billion payments and the other half divided by population, while tribal lands also split $20 billion, for a total of $540 billion for states, territories, and tribal governments.
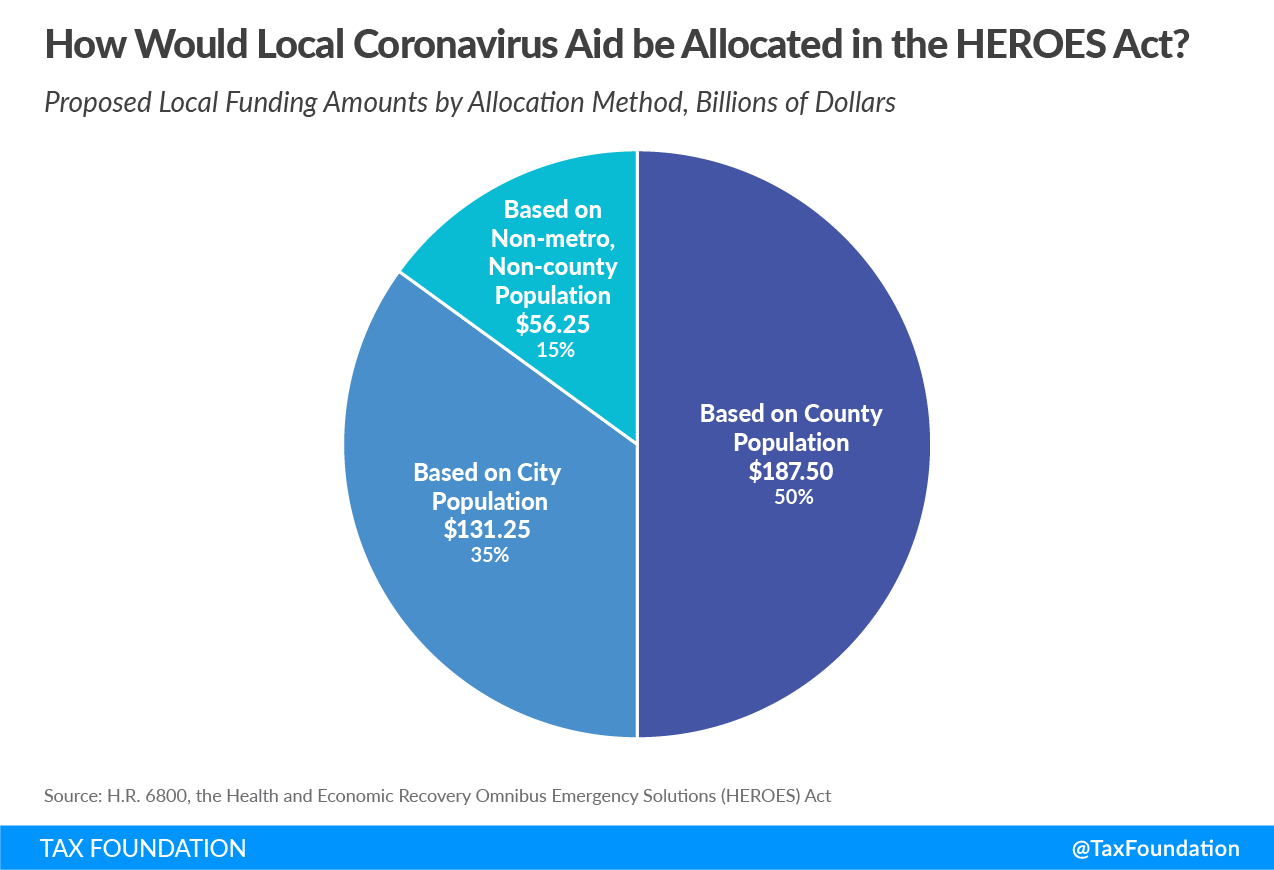
Local Funding
The bill’s local fiscal relief fund provides $375 billion in funding to localities, split as follows:
- $131.25 billion to metropolitan cities as defined under the Housing and Community Development Act of 1974—which is to say, cities that have populations of 50,000+ or are the principal city of a metropolitan statistical area
- $56.25 billion for general governments other than counties or parishes in nonentitlement areas (basically, non-county municipal governments that are not metropolitan cities), distributed to states for local use
- $187.5 billion for counties on the basis of population, with the proviso that urban counties (defined as those with a metropolitan area of 200,000+ that does not include the metropolitan city contained therein) receive no less funding than they would were they organized as a metropolitan city
Estimated Funding
The following table estimates the allocation of the $667 billion in “guaranteed” funding that is not contingent on COVID-19 cases or unemployment statistics as of spring 2021. Importantly, however, this estimate does not currently provide the gross-up for select urban counties and should thus be regarded as a provisional estimate.
| State/Territory | State Aid | Local Aid | Total Aid | Per Capita Aid |
|---|---|---|---|---|
| Alabama | $4,240,673,954 | $5,346,560,179 | $9,587,234,133 | $1,955 |
| Alaska | $2,334,303,892 | $870,034,327 | $3,204,338,219 | $4,380 |
| Arizona | $5,326,252,549 | $9,585,979,616 | $14,912,232,165 | $2,049 |
| Arkansas | $3,379,086,211 | $3,423,476,170 | $6,802,562,381 | $2,254 |
| California | $20,056,428,415 | $53,731,591,473 | $73,788,019,888 | $1,867 |
| Colorado | $4,631,646,525 | $7,199,231,812 | $11,830,878,337 | $2,054 |
| Connecticut | $3,629,276,831 | $3,345,220,678 | $6,974,497,509 | $1,956 |
| Delaware | $2,444,993,944 | $785,025,376 | $3,230,019,321 | $3,317 |
| Florida | $11,814,968,413 | $22,081,519,657 | $33,896,488,069 | $1,578 |
| Georgia | $6,851,985,634 | $10,077,159,575 | $16,929,145,208 | $1,594 |
| Hawaii | $2,647,029,943 | $1,143,164,060 | $3,790,194,003 | $2,677 |
| Idaho | $2,816,658,968 | $2,117,614,619 | $4,934,273,587 | $2,761 |
| Illinois | $7,790,811,334 | $16,843,851,546 | $24,634,662,880 | $1,944 |
| Indiana | $5,076,512,057 | $7,781,224,220 | $12,857,736,277 | $1,910 |
| Iowa | $3,441,814,489 | $3,948,585,967 | $7,390,400,456 | $2,342 |
| Kansas | $3,331,336,020 | $3,782,079,367 | $7,113,415,386 | $2,442 |
| Kentucky | $4,041,652,217 | $4,670,418,946 | $8,712,071,163 | $1,950 |
| Louisiana | $4,124,421,501 | $4,593,579,743 | $8,718,001,244 | $1,875 |
| Maine | $2,614,282,516 | $1,088,053,463 | $3,702,335,979 | $2,754 |
| Maryland | $4,762,775,158 | $4,807,684,470 | $9,570,459,628 | $1,583 |
| Massachusetts | $5,149,759,178 | $7,247,125,135 | $12,396,884,313 | $1,799 |
| Michigan | $6,563,827,464 | $10,192,560,785 | $16,756,388,250 | $1,678 |
| Minnesota | $4,577,217,979 | $7,184,315,610 | $11,761,533,589 | $2,086 |
| Mississippi | $3,360,050,569 | $2,927,825,852 | $6,287,876,421 | $2,113 |
| Missouri | $4,804,702,467 | $6,986,848,917 | $11,791,551,384 | $1,921 |
| Montana | $2,488,413,761 | $1,099,911,342 | $3,588,325,103 | $3,357 |
| Nebraska | $2,883,992,267 | $2,427,302,968 | $5,311,295,235 | $2,746 |
| Nevada | $3,407,580,037 | $3,417,308,963 | $6,824,889,000 | $2,216 |
| New Hampshire | $2,621,365,301 | $1,140,580,185 | $3,761,945,486 | $2,767 |
| New Jersey | $6,059,013,028 | $8,671,889,634 | $14,730,902,661 | $1,658 |
| New Mexico | $2,958,215,961 | $2,455,496,375 | $5,413,712,336 | $2,582 |
| New York | $10,889,953,664 | $22,780,026,247 | $33,669,979,911 | $1,731 |
| North Carolina | $6,792,879,863 | $11,243,981,612 | $18,036,861,475 | $1,720 |
| North Dakota | $2,348,249,653 | $940,029,031 | $3,288,278,684 | $4,315 |
| Ohio | $7,341,724,190 | $13,096,909,281 | $20,438,633,471 | $1,749 |
| Oklahoma | $3,808,269,902 | $4,934,764,599 | $8,743,034,501 | $2,210 |
| Oregon | $3,927,435,625 | $5,033,777,678 | $8,961,213,303 | $2,125 |
| Pennsylvania | $7,850,295,944 | $12,149,683,941 | $19,999,979,885 | $1,562 |
| Rhode Island | $2,484,110,349 | $1,109,049,393 | $3,593,159,742 | $3,392 |
| South Carolina | $4,352,876,622 | $4,529,739,480 | $8,882,616,101 | $1,725 |
| South Dakota | $2,404,274,442 | $1,034,625,268 | $3,438,899,710 | $3,887 |
| Tennessee | $5,120,818,878 | $7,539,433,340 | $12,660,252,218 | $1,854 |
| Texas | $15,250,635,116 | $36,042,679,684 | $51,293,314,800 | $1,769 |
| Utah | $3,465,069,458 | $4,324,507,785 | $7,789,577,243 | $2,430 |
| Vermont | $2,285,152,590 | $483,393,250 | $2,768,545,840 | $4,437 |
| Virginia | $5,900,590,149 | $7,700,460,473 | $13,601,050,623 | $1,593 |
| Washington | $5,479,879,387 | $8,813,322,943 | $14,293,202,329 | $1,877 |
| West Virginia | $2,818,981,357 | $1,537,633,470 | $4,356,614,828 | $2,431 |
| Wisconsin | $4,660,755,451 | $6,906,440,207 | $11,567,195,658 | $1,987 |
| Wyoming | $2,264,483,232 | $658,959,283 | $2,923,442,515 | $5,051 |
| District of Columbia | $2,322,515,549 | $1,092,905,076 | $3,415,420,625 | $4,839 |
| American Samoa | $2,138,407,683 | $28,712,078 | $2,167,119,760 | $42,638 |
| Guam | $2,456,871,163 | $94,775,955 | $2,551,647,118 | $15,209 |
| Northern Mariana Islands | $2,141,588,342 | $29,371,892 | $2,170,960,233 | $41,754 |
| Puerto Rico | $10,971,816,584 | $1,861,164,706 | $12,832,981,290 | $3,895 |
| Virgin Islands | $2,291,316,229 | $60,432,297 | $2,351,748,526 | $21,984 |
| Tribal Governments | $20,000,000,000 | n.a. | $20,000,000,000 | n.a. |
| Totals | $292,000,000,000 | $375,000,000,000 | $667,000,000,000 | $2,010 avg. |
| Sources: HEROES Act; U.S. Census Bureau; Tax Foundation calculations. | ||||
Taxes make more sense with us in your inbox.
Subscribe to our newsletter for tax insights that cut through the noise—and make sense of it.
Sign UpFinally, while we obviously cannot know what COVID-19 cases or unemployment will look like in the spring of 2021, we can make rough approximations as to how the aid would be distributed based on current conditions. The following table estimates distribution of the $49 billion allocated by COVID-19 cases (using the latest May CDC data) and the $199 billion allocated by unemployment (a very rough estimate using unemployment claims data to apportion job losses), and then sums them with the total of “guaranteed” state and local aid. This should be regarded as no more than a rough estimate based on current conditions but may help illustrate how funding under the HEROES Act could work.
| State/Territory | COVID Cases | Unemployment | Total (current data) | Per Capita Aid |
|---|---|---|---|---|
| Alabama | $326,117,707 | $3,136,179,186 | $13,049,531,026 | $2,661 |
| Alaska | $22,215,103 | $427,996,218 | $3,654,549,540 | $4,996 |
| Arizona | $313,529,149 | $3,335,418,804 | $18,561,180,118 | $2,550 |
| Arkansas | $121,072,309 | $1,247,092,429 | $8,170,727,119 | $2,708 |
| California | $1,938,786,058 | $25,288,673,103 | $101,015,479,049 | $2,557 |
| Colorado | $635,500,036 | $2,206,394,298 | $14,672,772,671 | $2,548 |
| Connecticut | $1,176,215,635 | $1,822,673,550 | $9,973,386,694 | $2,797 |
| Delaware | $153,654,460 | $560,822,631 | $3,944,496,411 | $4,051 |
| Florida | $1,679,017,458 | $10,463,769,612 | $14,053,208,541 | $19,912 |
| Georgia | $1,218,202,179 | $10,655,629,986 | $46,231,135,513 | $2,153 |
| Hawaii | $40,061,235 | $1,475,849,029 | $19,623,196,415 | $1,848 |
| Idaho | $119,147,001 | $833,854,701 | $4,664,109,939 | $3,294 |
| Illinois | $1,905,537,454 | $6,242,841,391 | $11,296,261,978 | $6,321 |
| Indiana | $706,588,365 | $4,471,822,556 | $31,012,022,891 | $2,447 |
| Iowa | $158,541,783 | $1,852,190,531 | $15,416,515,172 | $2,290 |
| Kansas | $117,591,943 | $1,697,226,383 | $9,246,168,621 | $2,931 |
| Kentucky | $179,868,281 | $4,412,788,595 | $11,643,795,925 | $3,997 |
| Louisiana | $1,668,502,309 | $3,320,660,314 | $12,212,599,758 | $2,734 |
| Maine | $58,944,072 | $730,545,269 | $11,117,048,822 | $2,391 |
| Maryland | $856,910,559 | $2,722,941,458 | $6,484,221,509 | $4,824 |
| Massachusetts | $2,383,014,060 | $4,582,511,234 | $15,009,881,421 | $2,483 |
| Michigan | $2,166,935,162 | $8,936,265,868 | $23,716,164,241 | $3,441 |
| Minnesota | $149,063,339 | $3,947,896,151 | $22,871,219,563 | $2,290 |
| Mississippi | $280,872,948 | $1,608,675,441 | $13,519,272,368 | $2,397 |
| Missouri | $378,471,299 | $3,542,037,668 | $10,110,787,037 | $3,397 |
| Montana | $31,249,244 | $523,926,405 | $12,693,949,088 | $2,068 |
| Nebraska | $78,937,665 | $745,303,759 | $4,364,878,107 | $4,084 |
| Nevada | $245,921,186 | $3,202,592,392 | $8,592,825,292 | $4,442 |
| New Hampshire | $89,674,964 | $1,062,611,301 | $8,133,421,487 | $2,641 |
| New Jersey | $5,577,249,619 | $6,515,873,461 | $10,367,493,911 | $7,625 |
| New Mexico | $118,258,396 | $737,924,514 | $21,046,076,795 | $2,369 |
| New York | $16,046,931,293 | $10,854,869,605 | $16,386,840,338 | $7,815 |
| North Carolina | $404,685,120 | $5,335,194,238 | $55,052,105,442 | $2,830 |
| North Dakota | $29,101,784 | $391,099,993 | $18,832,646,587 | $1,796 |
| Ohio | $623,059,579 | $7,394,003,633 | $10,711,384,101 | $14,056 |
| Oklahoma | $174,684,757 | $2,287,565,994 | $23,349,259,044 | $1,998 |
| Oregon | $128,551,394 | $2,036,671,659 | $10,954,390,917 | $2,768 |
| Pennsylvania | $2,053,786,239 | $11,386,175,255 | $20,475,939,952 | $4,855 |
| Rhode Island | $293,905,808 | $988,818,849 | $23,042,584,973 | $1,800 |
| South Carolina | $291,091,895 | $2,973,835,792 | $6,860,901,343 | $6,476 |
| South Dakota | $97,079,999 | $236,135,845 | $9,409,843,841 | $1,828 |
| Tennessee | $463,703,242 | $3,077,145,224 | $6,613,124,933 | $7,475 |
| Texas | $1,218,498,380 | $11,865,826,189 | $24,989,781,650 | $3,659 |
| Utah | $204,378,944 | $1,195,437,713 | $53,707,250,893 | $1,852 |
| Vermont | $56,870,663 | $354,203,767 | $8,348,159,954 | $2,604 |
| Virginia | $554,711,113 | $3,933,137,661 | $6,758,554,164 | $10,831 |
| Washington | $825,809,416 | $6,161,669,694 | $20,317,431,430 | $2,380 |
| West Virginia | $54,723,203 | $959,301,869 | $16,078,313,614 | $2,111 |
| Wisconsin | $286,945,076 | $3,291,143,334 | $7,702,481,364 | $4,298 |
| Wyoming | $29,694,187 | $228,756,599 | $12,082,897,333 | $2,075 |
| District of Columbia | $174,018,304 | $405,858,483 | $3,358,995,185 | $5,804 |
| American Samoa | no data | no data | $2,167,119,760 | $42,638 |
| Guam | $9,996,796 | no data | $2,561,643,914 | $15,269 |
| Northern Mariana Islands | $962,654 | no data | $2,171,922,888 | $41,773 |
| Puerto Rico | $77,234,507 | $1,317,010,777 | $14,227,226,573 | $4,318 |
| Virgin Islands | $3,924,668 | $15,149,590 | $2,370,822,784 | $22,162 |
| Tribal Governments | — | — | $20,000,000,000 | — |
| Totals | $49,000,000,000 | $199,000,000,000 | $915,000,000,000 | $2,757 avg. |
|
Sources: HEROES Act; U.S. Census Bureau; Centers for Disease Control and Prevention; U.S. Department of Labor; Tax Foundation calculations. Errata: Table 2 has been revised since publication to correct an error in the calculation of unemployment-based relief. A reference to the timing of COVID-19 case calculations has also been corrected. |
||||
Taxes make more sense with us in your inbox.
Subscribe to our newsletter for tax insights that cut through the noise—and make sense of it.
Sign Up