


A recent report from the TaxA tax is a mandatory payment or charge collected by local, state, and national governments from individuals or businesses to cover the costs of general government services, goods, and activities. Foundation reveals that European countries’ tax systems significantly depend on businesses. Businesses contribute significantly to tax collection both through taxes they are legally liable to pay and taxes they are required to collect and remit on behalf of others. In Europe, businesses either pay or remit 87 percent of all the taxes collected. Without businesses as their taxpayers and tax collectors, governments would not have the resources to provide even the most basic services.
Businesses’ Legal Tax Liability
The taxes that businesses are directly liable for are corporate and non-corporate business income taxes, private sector employer’s social security contributions, and payroll and excise taxes. They are also liable for the taxes on investment goods and the business portion of recurrent taxes on immovable property, net wealth, motor vehicles, and other licenses or taxes paid solely by businesses.
The average European country receives 38.4 percent of its tax revenues from taxes that businesses are directly liable for. Czechia, Poland, and the Slovak Republic are the most business-reliant countries in Europe with businesses paying more than 50 percent of their country’s total tax collection. Spain is the 4th-most business-reliant European country with 48.8 percent of its total tax collection paid by businesses.
In France and Germany, businesses pay above the European average, at 42.6 percent and 40.9 percent of their country’s total tax collection, respectively.
Denmark and Iceland could be considered the least business-reliant, with 15.1 percent and 16.6 percent of their total tax collections paid by businesses, respectively. However, Denmark’s low reliance on businesses is due to the country’s low reliance on social security contributions.
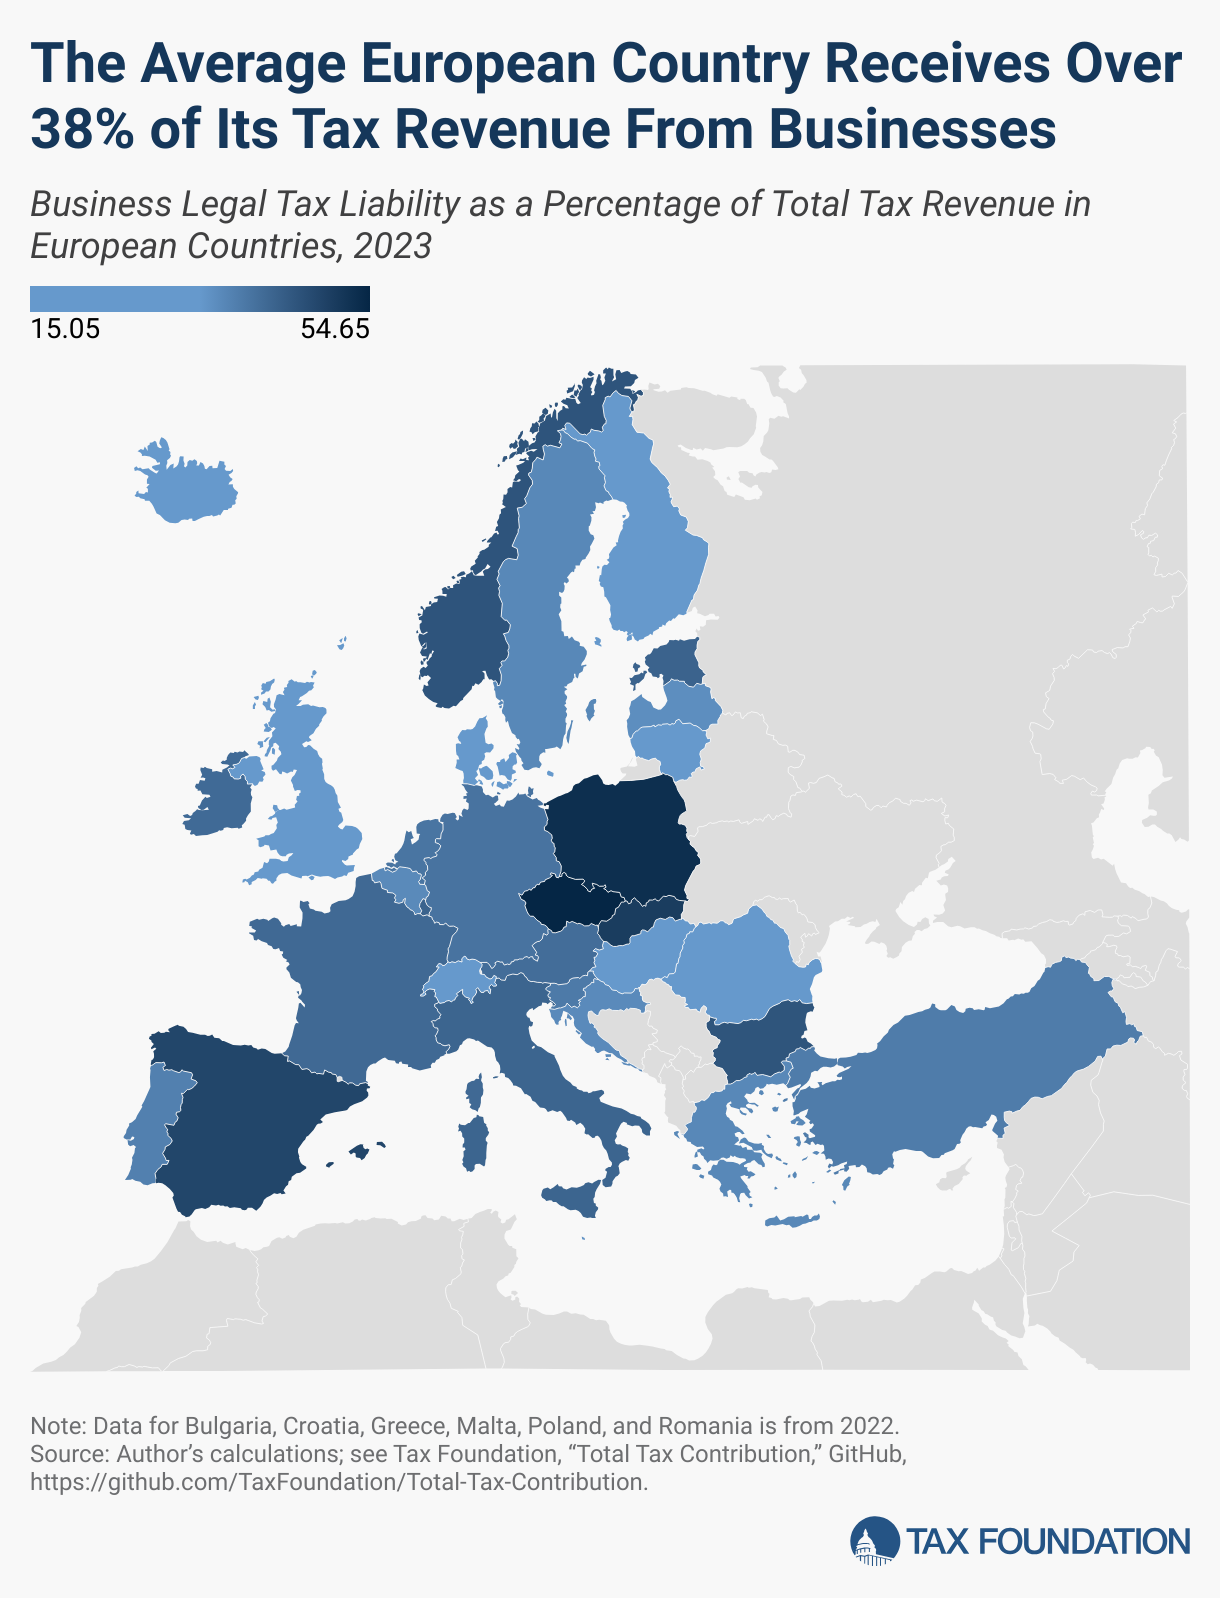
The Average European Country Receives Over 38% of Its Tax Revenue From Businesses
Business Legal Tax Liability as a Percentage of Total Tax Revenue in European Countries, 2023
| Country | Business Legal Tax Liability |
|---|---|
| Austria | 41.93% |
| Belgium | 37.25% |
| Bulgaria | 46.11% |
| Croatia | 37.16% |
| Czechia | 54.65% |
| Denmark | 15.05% |
| Estonia | 43.63% |
| Finland | 34.75% |
| France | 42.57% |
| Germany | 40.93% |
| Greece | 37.62% |
| Hungary | 29.69% |
| Iceland | 16.59% |
| Ireland | 42.39% |
| Italy | 43.30% |
| Latvia | 36.55% |
| Lithuania | 24.77% |
| Luxembourg | 43.57% |
| Malta | 35.93% |
| Netherlands | 40.65% |
| Norway | 46.14% |
| Poland | 52.98% |
| Portugal | 38.85% |
| Romania | 27.74% |
| Slovak Republic | 50.43% |
| Slovenia | 39.84% |
| Spain | 48.78% |
| Sweden | 37.53% |
| Switzerland | 32.21% |
| Turkey | 39.47% |
| United Kingdom | 32.40% |
Source: Author’s calculations; see Tax Foundation, “Total Tax Contribution,” GitHub, https://github.com/TaxFoundation/Total-Tax-Contribution.
Income taxes from corporations and pass-through businesses comprise an average of 11.4 percent of all tax collections for European countries. While Norway and Ireland collect the most at 30.5 percent and 25.8 percent of total tax revenues, respectively, Latvia collects the least amount at 4.2 percent of total collections. France also collects only 6.2 percent from corporations, while Germany and Spain collect 12.2 percent and 14.4 percent, respectively.
Excise taxes are typically considered to be a tax on individual consumers, but European countries collect an average of 6.6 percent of their total tax revenues from excise taxes paid by businesses on input purchases. Norway, Switzerland, Austria, and Germany collect the least amount of excise taxes on business inputs at 3.4 percent, 3.9 percent, 4 percent, and 4.2 percent of tax revenues, respectively. Turkey, Bulgaria, and Croatia collect the most in excise taxes at 15.1 percent, 10.8 percent, and 10.4 percent of total tax revenues, respectively.
In addition to the corporate income taxA corporate income tax (CIT) is levied by federal and state governments on business profits. Many companies are not subject to the CIT because they are taxed as pass-through businesses, with income reportable under the individual income tax. , excises, and a small amount of property taxes, businesses in many countries are also paying a growing share of the social security contributions. While these contributions are generally split between the employee and the employer, on average, across European countries, employer social security contributions made up 59.9 of all social security contributions in 2023. Additionally, social security payments by businesses averaged 15.8 percent of total tax revenues. However, business payments for employer social security contributions exclude public employees.
Czechia, the Slovak Republic, Estonia, Spain, and France collected the most from business social security payments at 32.6 percent, 28 percent, 26.1 percent, 25.3 percent, and 25.2 percent of total tax revenues, respectively. Germany only collected 20.7 percent, while Iceland and Denmark collected less than 1 percent of their total country’s tax revenue from businesses’ social security contributions.
Social security contributions were the largest source of tax revenue in eight European countries—Austria, Czechia, France, Germany, Poland, the Slovak Republic, Slovenia, and Spain. Unsurprisingly, a number of these countries lead the list of those most dependent upon business tax payments.
Policymakers should weigh the marginal benefit of generating additional tax revenues from companies against the economic harm caused by the loss of investment, jobs, and economic growth that businesses facilitate.
Businesses’ Legal Remittance Responsibility
As significant as the direct contribution of businesses is, they play an even larger role for governments by collecting taxes and remitting them on behalf of others.
Businesses’ legal remittance responsibility includes withholdingWithholding is the income an employer takes out of an employee’s paycheck and remits to the federal, state, and/or local government. It is calculated based on the amount of income earned, the taxpayer’s filing status, the number of allowances claimed, and any additional amount the employee requests. taxes on the income earned by employees or the capital income earned by shareholders, the employee’s share of social security contributions, and value-added and sales taxes paid to retailers by customers.
Businesses collect and remit an average of 48.4 percent of the total tax revenues in European countries. Lithuania relies the most on tax remittances by business at 73.5 percent of all tax collections. In Hungary, Romania, and Denmark, businesses remit more than 62 percent of all collections, and in nine other countries, businesses remit more than 50 percent of all tax collections. Turkey could be considered the least reliant on business remittances, collecting roughly 32.7 percent of all tax revenues from this source.
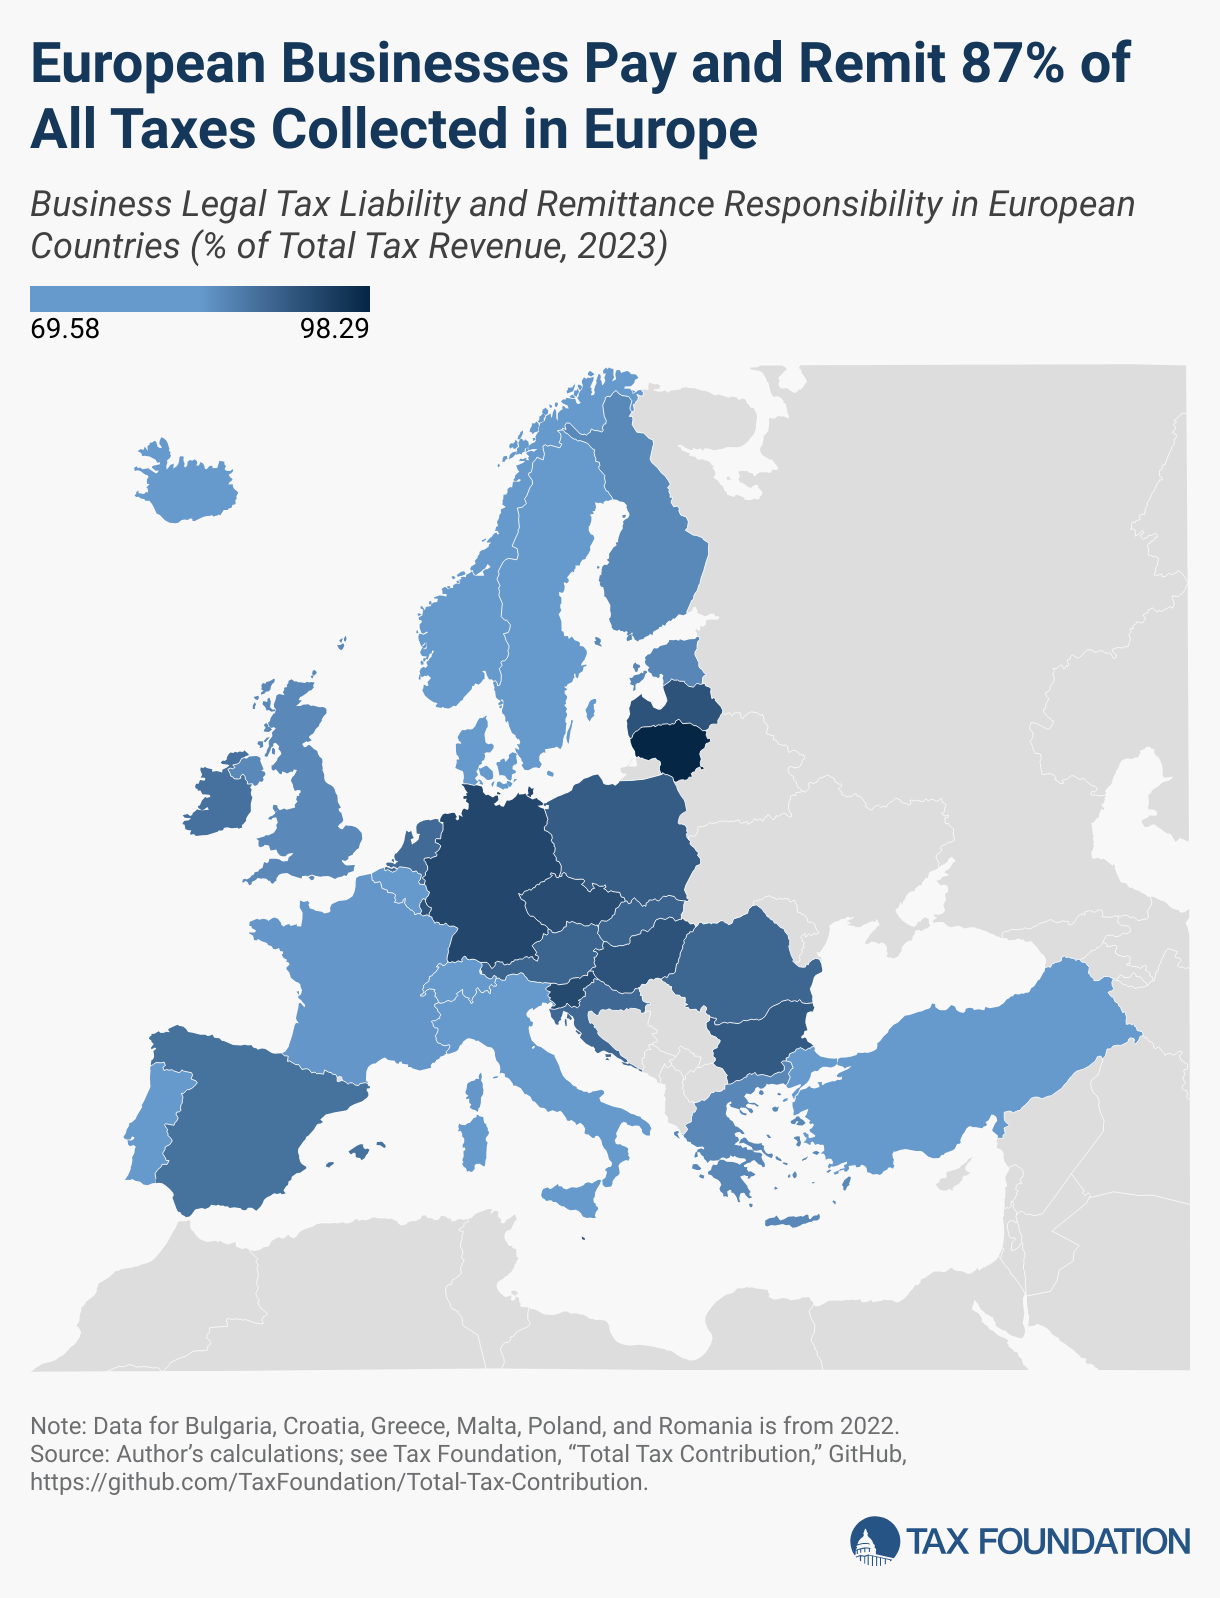
European Businesses Pay and Remit 87% of All Taxes Collected in Europe
Business Legal Tax Liability and Remittance Responsibility in European Countries (% of Total Tax Revenue, 2023)
| Country | Business Legal Tax Liability and Remittance Responsibility |
|---|---|
| Austria | 90.18% |
| Belgium | 83.66% |
| Bulgaria | 91.37% |
| Croatia | 89.58% |
| Czechia | 93.15% |
| Denmark | 77.23% |
| Estonia | 85.97% |
| Finland | 85.83% |
| France | 84.22% |
| Germany | 93.81% |
| Greece | 85.95% |
| Hungary | 92.36% |
| Iceland | 69.58% |
| Ireland | 88.58% |
| Italy | 80.53% |
| Latvia | 92.31% |
| Lithuania | 98.29% |
| Luxembourg | 92.30% |
| Malta | 92.59% |
| Netherlands | 89.37% |
| Norway | 83.03% |
| Poland | 91.21% |
| Portugal | 75.52% |
| Romania | 89.99% |
| Slovak Republic | 90.32% |
| Slovenia | 93.51% |
| Spain | 88.53% |
| Sweden | 82.69% |
| Switzerland | 83.02% |
| Turkey | 72.16% |
| United Kingdom | 85.85% |
Source: Author’s calculations; see Tax Foundation, “Total Tax Contribution,” GitHub, https://github.com/TaxFoundation/Total-Tax-Contribution.
Overall, on average, businesses are liable for collecting, paying, and remitting more than 87 percent of the total tax collections in European countries. In Lithuania, Germany, Slovenia, and Czechia, businesses pay and remit more than 93 percent of all taxes. In France and Spain, businesses pay and remit 84.2 percent and 88.5 percent of all taxes, respectively.
While each country may have a different mix of business tax payments and tax remittances, it is clear that public finance systems are heavily reliant on businesses as the primary taxpayer and tax collectors. Put simply, if all firms closed, European governments would need to find a new way to collect 87 percent of the tax revenue they receive each year.
Additionally, a European Commission report found that tax compliance costs represent 29 percent of the total taxes paid and remitted by an average European Union company. Without businesses acting as tax collectors and bearing these compliance costs, governments’ tax collection agencies would need to incur significant additional costs to raise a similar or even lower amount of tax revenue.
Business and Non-Business Sources of Revenue in European Countries (% of Total Tax Revenue, 2023)
| Country | Business Legal Tax Liability | Taxes Remitted by Business | Non-Business Remittance & Unallocated Revenue |
|---|---|---|---|
| Austria | 41.93% | 48.25% | 9.82% |
| Belgium | 37.25% | 46.41% | 16.34% |
| Bulgaria* | 46.11% | 45.26% | 8.63% |
| Croatia* | 37.16% | 52.42% | 10.42% |
| Czechia | 54.65% | 38.50% | 6.85% |
| Denmark | 15.05% | 62.18% | 22.77% |
| Estonia | 43.63% | 42.34% | 14.03% |
| Finland | 34.75% | 51.08% | 14.17% |
| France | 42.57% | 41.65% | 15.78% |
| Germany | 40.93% | 52.88% | 6.19% |
| Greece* | 37.62% | 48.33% | 14.05% |
| Hungary | 29.69% | 62.67% | 7.64% |
| Iceland | 16.59% | 52.99% | 30.42% |
| Ireland | 42.39% | 46.19% | 11.42% |
| Italy | 43.30% | 37.23% | 19.47% |
| Latvia | 36.55% | 55.76% | 7.69% |
| Lithuania | 24.77% | 73.52% | 1.71% |
| Luxembourg | 43.57% | 48.73% | 7.70% |
| Malta* | 35.93% | 56.66% | 7.41% |
| Netherlands | 40.65% | 48.72% | 10.63% |
| Norway | 46.14% | 36.89% | 16.97% |
| Poland* | 52.98% | 38.23% | 8.79% |
| Portugal | 38.85% | 36.67% | 24.48% |
| Romania* | 27.74% | 62.25% | 10.01% |
| Slovak Republic | 50.43% | 39.89% | 9.68% |
| Slovenia | 39.84% | 53.67% | 6.49% |
| Spain | 48.78% | 39.75% | 11.47% |
| Sweden | 37.53% | 45.16% | 17.31% |
| Switzerland | 32.21% | 50.81% | 16.98% |
| Turkey | 39.47% | 32.69% | 27.84% |
| United Kingdom | 32.40% | 53.45% | 14.15% |
| United States (for comparison only) | 39.54% | 48.05% | 12.41% |
| Average** | 38.43% | 48.43% | 13.11% |
| EU Average | 39.41% | 49.02% | 11.55% |
* 2022 data.
**Average of the countries above. Does not include the United States.
Source: Author’s calculations; see Tax Foundation, “Total Tax Contribution,” GitHub, https://github.com/TaxFoundation/Total-Tax-Contribution.
Stay informed on the tax policies impacting you.
Subscribe to get insights from our trusted experts delivered straight to your inbox.
Subscribe