


Comparing Europe’s Tax Systems: Property Taxes
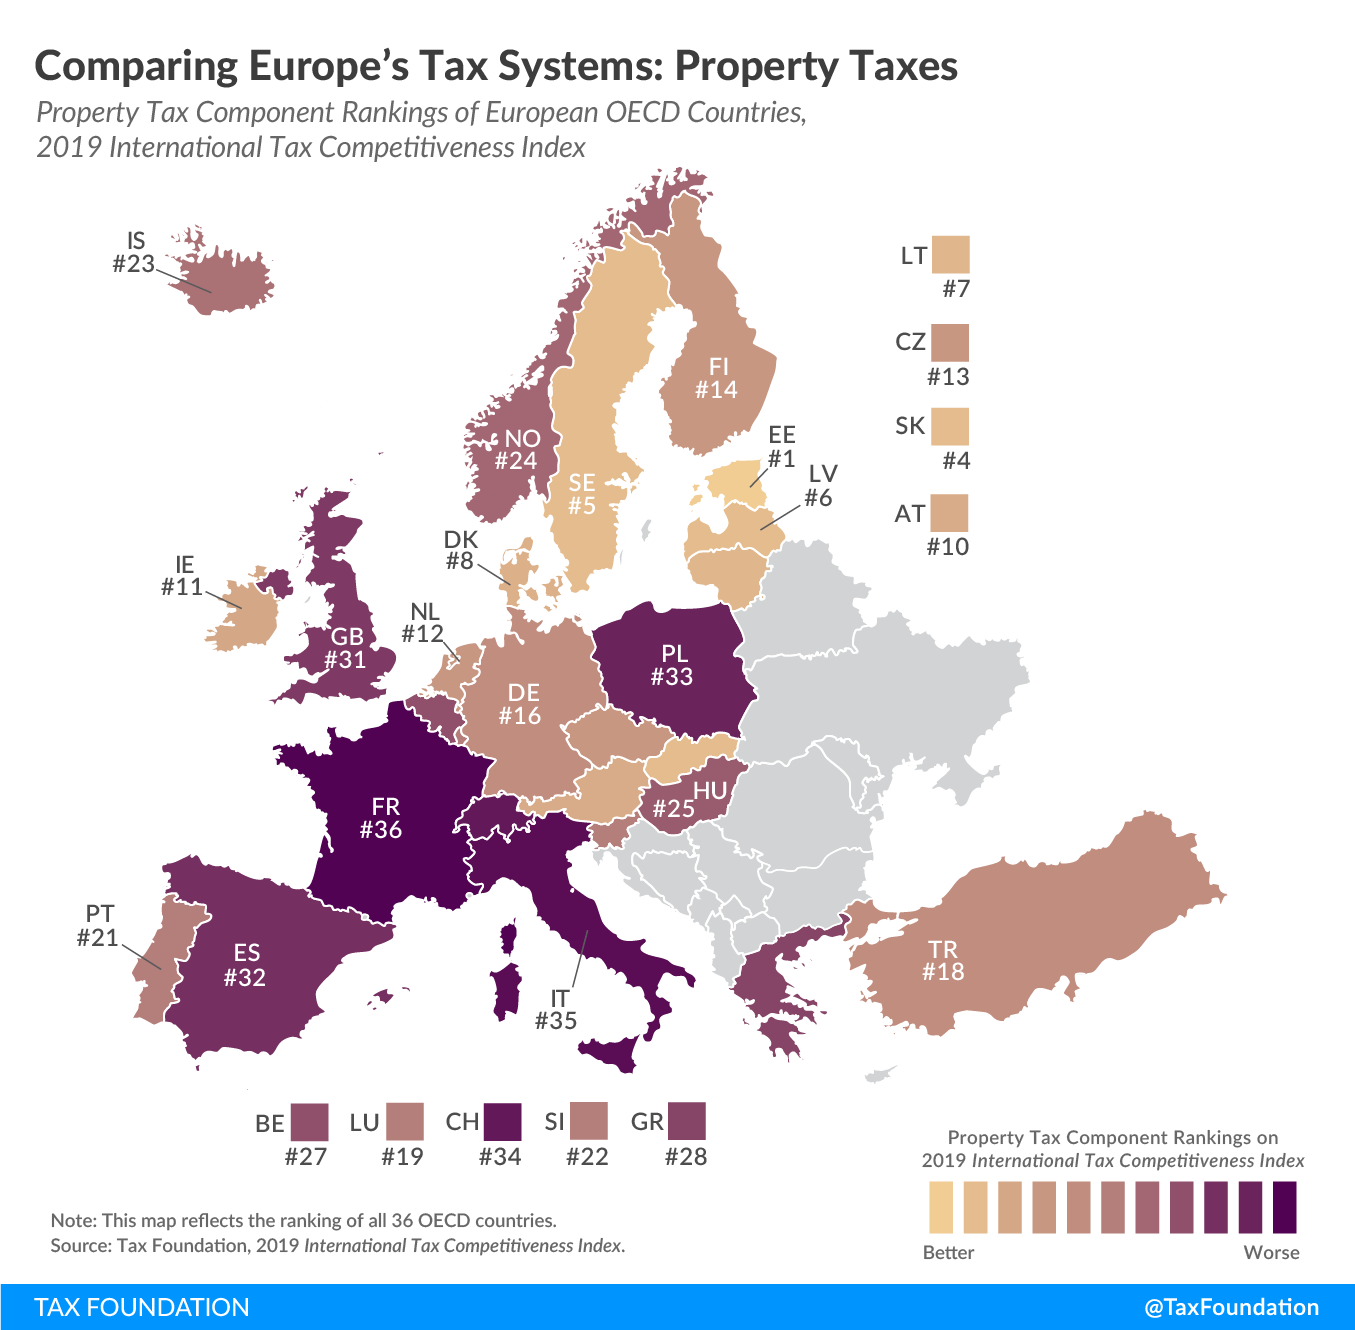
2 min readBy:Today’s map shows how European OECD countries rank on property taxes, continuing our series on the component rankings of the 2019 International Tax Competitiveness Index (ITCI). Although an important element when measuring the neutrality and competitiveness of a country’s taxA tax is a mandatory payment or charge collected by local, state, and national governments from individuals or businesses to cover the costs of general government services, goods, and activities. code, property taxes account on average for less than 5 percent of total tax revenue in European OECD countries.
The ITCI’s property taxA property tax is primarily levied on immovable property like land and buildings, as well as on tangible personal property that is movable, like vehicles and equipment. Property taxes are the single largest source of state and local revenue in the U.S. and help fund schools, roads, police, and other services. component measures and compares the base and amount of real property taxes and whether a country levies further types of property taxes, such as wealth taxes, estate and inheritance taxes, property transfer taxes, corporate asset taxes, capital duties, and financial transaction taxes.
Click the link below to see an interactive version of OECD countries’ property tax rankings, then click on your country for more information about what the strengths and weaknesses of its tax system are and how it compares to the top and bottom five countries in the OECD.
Explore Our New Interactive Tool
Estonia has the most efficient property tax system among OECD countries. Estonia’s real property tax only applies to the value of land, making it one of only three OECD countries (along with Australia and New Zealand) that exclude the value of buildings or structures on the land from the tax base. Estonia does not levy any other type of property tax covered in the ITCI.
France, by contrast, ranks lowest in the ITCI’s property tax component. In addition to relatively high real property tax collections, France imposes taxes on net real estate wealth, inheritances, real estate transfers, equity of banks (so-called systemic risk tax), and financial transactions. Capital duties, levied on the issuance of shares, were abolished this year.
To see whether your country’s property tax rank has improved in recent years, check out the table below. To learn more about how we determined these rankings, read our full methodology here.
| OECD Country | 2017 Rank | 2018 Rank | 2019 Rank | Change from 2018 to 2019 |
|---|---|---|---|---|
| Australia (AU) | 3 | 3 | 3 | 0 |
| Austria (AT) | 10 | 10 | 10 | 0 |
| Belgium (BE) | 18 | 28 | 27 | 1 |
| Canada (CA) | 22 | 21 | 20 | 1 |
| Chile (CL) | 17 | 17 | 17 | 0 |
| Czech Republic (CZ) | 13 | 13 | 13 | 0 |
| Denmark (DK) | 9 | 9 | 8 | 1 |
| Estonia (EE) | 1 | 1 | 1 | 0 |
| Finland (FI) | 14 | 14 | 14 | 0 |
| France (FR) | 36 | 36 | 36 | 0 |
| Germany (DE) | 16 | 16 | 16 | 0 |
| Greece (GR) | 29 | 27 | 28 | -1 |
| Hungary (HU) | 26 | 25 | 25 | 0 |
| Iceland (IS) | 24 | 23 | 23 | 0 |
| Ireland (IE) | 12 | 11 | 11 | 0 |
| Israel (IL) | 15 | 15 | 15 | 0 |
| Italy (IT) | 35 | 35 | 35 | 0 |
| Japan (JP) | 28 | 30 | 30 | 0 |
| Korea (KR) | 27 | 26 | 26 | 0 |
| Latvia (LV) | 6 | 5 | 6 | -1 |
| Lithuania (LT) | 7 | 6 | 7 | -1 |
| Luxembourg (LU) | 20 | 19 | 19 | 0 |
| Mexico (MX) | 8 | 8 | 9 | -1 |
| Netherlands (NL) | 11 | 12 | 12 | 0 |
| New Zealand (NZ) | 2 | 2 | 2 | 0 |
| Norway (NO) | 25 | 24 | 24 | 0 |
| Poland (PL) | 32 | 33 | 33 | 0 |
| Portugal (PT) | 21 | 20 | 21 | -1 |
| Slovak Republic (SK) | 4 | 4 | 4 | 0 |
| Slovenia (SI) | 23 | 22 | 22 | 0 |
| Spain (ES) | 33 | 32 | 32 | 0 |
| Sweden (SE) | 5 | 7 | 5 | 2 |
| Switzerland (CH) | 34 | 34 | 34 | 0 |
| Turkey (TR) | 19 | 18 | 18 | 0 |
| United Kingdom (GB) | 31 | 31 | 31 | 0 |
| United States (US) | 30 | 29 | 29 | 0 |
Note: This is part of a map series in which we examine each of the five components of our 2019 International Tax Competitiveness Index.
Stay informed on the tax policies impacting you.
Subscribe to our free newsletter to get the latest tax data, news and analysis.
SubscribeAbout the Author

Elke Asen
Policy Analyst
Elke Asen was a Policy Analyst with the Tax Foundation’s Center for Global Tax Policy, focusing on international tax issues and tax policy in Europe. Prior to joining the Tax Foundation, Elke interned with the EU Delegation in Washington, D.C., the German Development Agency, and a social startup in Munich, Germany. She holds a BS in Economics from Ludwig Maximilian University of Munich.