


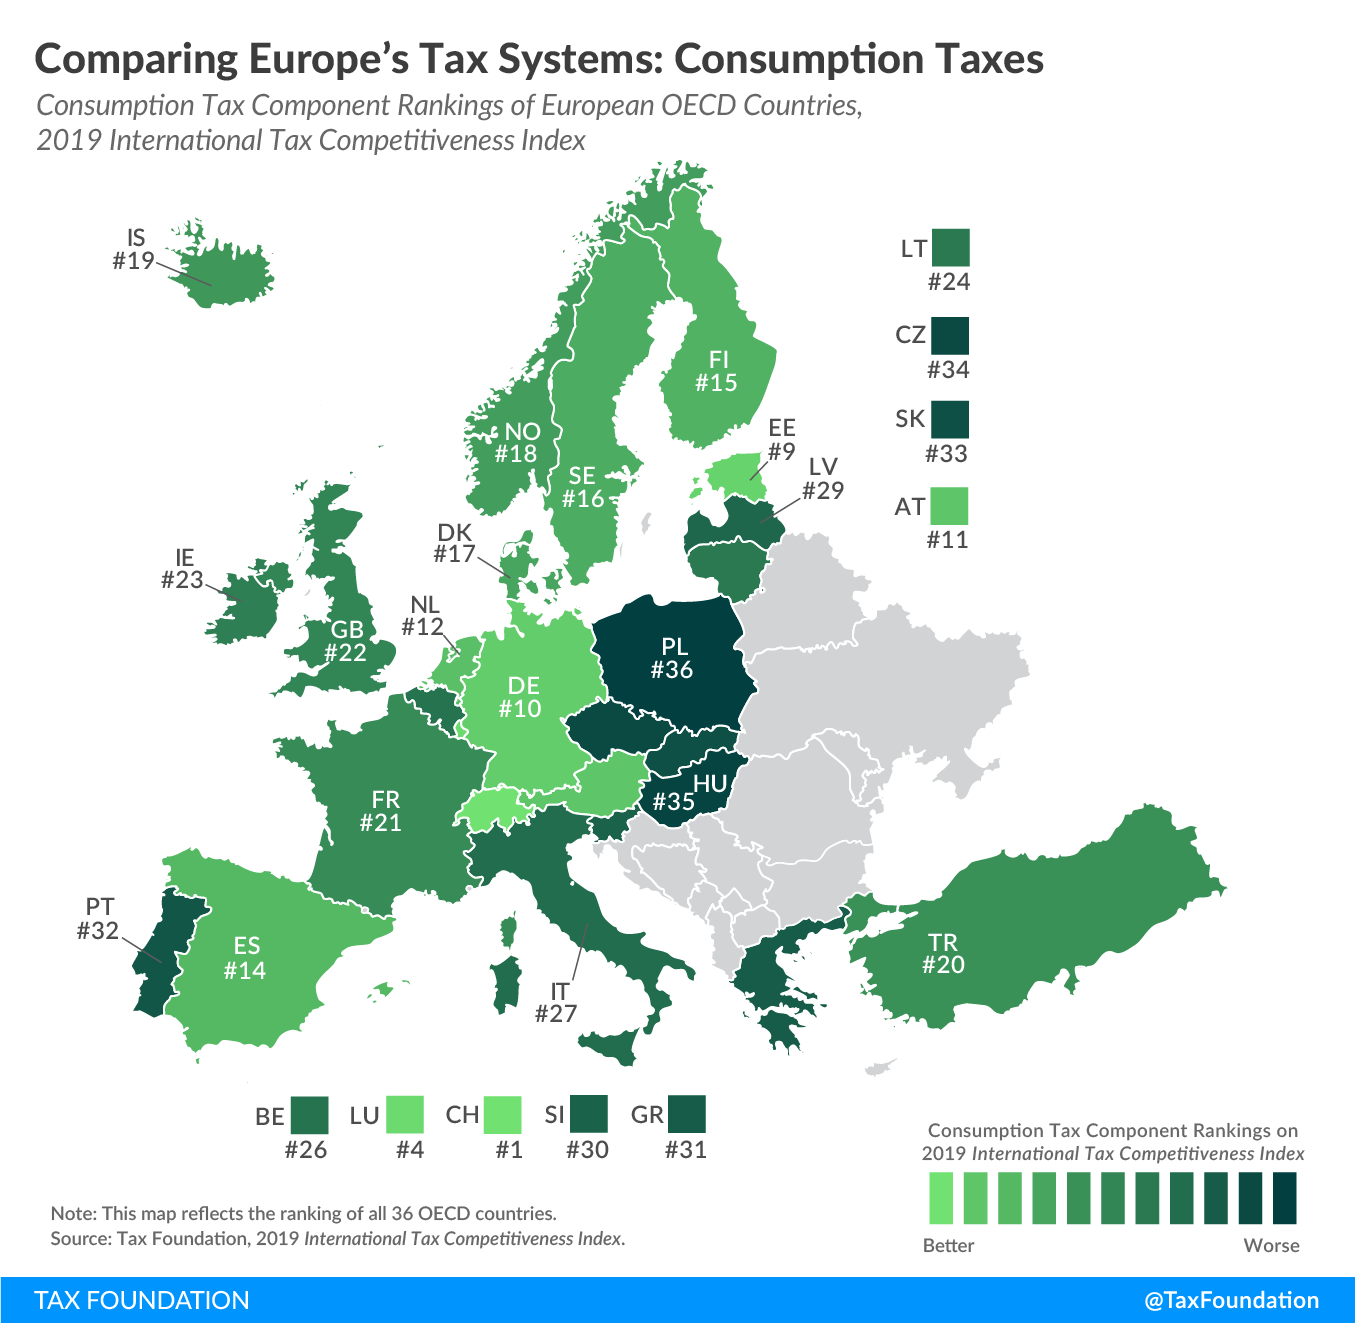
Comparing Europe’s Tax Systems: Consumption Taxes
2 min readBy:Today we examine how European countries rank on consumption taxes, continuing our map series on our recently published 2019 International Tax Competitiveness Index (ITCI). The ITCI measures and compares the competitiveness and neutrality of all 36 OECD countries’ taxA tax is a mandatory payment or charge collected by local, state, and national governments from individuals or businesses to cover the costs of general government services, goods, and activities. systems, looking at corporate income taxes, individual taxes, consumption taxes, property taxes, and the international tax system.
The ITCI’s consumption taxA consumption tax is typically levied on the purchase of goods or services and is paid directly or indirectly by the consumer in the form of retail sales taxes, excise taxes, tariffs, value-added taxes (VAT), or an income tax where all savings is tax-deductible. component compares the rate, base, and complexity of the value-added tax (VAT)/sales taxA sales tax is levied on retail sales of goods and services and, ideally, should apply to all final consumption with few exemptions. Many governments exempt goods like groceries; base broadening, such as including groceries, could keep rates lower. A sales tax should exempt business-to-business transactions which, when taxed, cause tax pyramiding. across OECD countries. While in some countries, such as the United States, consumption taxes take the form of a sales tax, all European countries covered in today’s map levy a VAT.
Click the link below to see an interactive version of OECD countries’ consumption tax rankings, then click on your country for more information about what the strengths and weaknesses of its tax system are and how it compares to the top and bottom five countries in the OECD.
Explore Our New Interactive Tool
According to our Index, Switzerland has the best-structured consumption tax among OECD countries. At a rate of 7.7 percent, Switzerland levies the lowest VAT rate of all European OECD countries (the United States has the lowest sales tax rate in the OECD at an average of 7.4 percent). The Swiss VAT is levied on 68 percent of final consumption, making it the OECD country with the sixth broadest consumption tax base. Switzerland’s VAT is the easiest to comply with among OECD countries, requiring on average only eight hours a year in compliance time.
Poland’s VAT, by contrast, is characterized by a high rate (23 percent), narrow base (44 percent of final consumption), and high complexity (172 hours annual compliance time). As a result, Poland ranks last in the ITCI’s consumption tax component.
To see whether your country’s consumption tax rank has improved in recent years, check out the table below. To learn more about how we determined these rankings, read our full methodology here.
| OECD Country | 2017 Rank | 2018 Rank | 2019 Rank | Change from 2018 to 2019 |
|---|---|---|---|---|
| Australia (AU) | 8 | 7 | 8 | -1 |
| Austria (AT) | 11 | 10 | 11 | -1 |
| Belgium (BE) | 25 | 25 | 26 | -1 |
| Canada (CA) | 9 | 9 | 7 | 2 |
| Chile (CL) | 30 | 30 | 28 | 2 |
| Czech Republic (CZ) | 33 | 34 | 34 | 0 |
| Denmark (DK) | 18 | 17 | 17 | 0 |
| Estonia (EE) | 7 | 8 | 9 | -1 |
| Finland (FI) | 13 | 13 | 15 | -2 |
| France (FR) | 20 | 20 | 21 | -1 |
| Germany (DE) | 12 | 12 | 10 | 2 |
| Greece (GR) | 31 | 31 | 31 | 0 |
| Hungary (HU) | 35 | 35 | 35 | 0 |
| Iceland (IS) | 17 | 18 | 19 | -1 |
| Ireland (IE) | 23 | 23 | 23 | 0 |
| Israel (IL) | 14 | 14 | 13 | 1 |
| Italy (IT) | 21 | 24 | 27 | -3 |
| Japan (JP) | 3 | 3 | 3 | 0 |
| Korea (KR) | 2 | 2 | 2 | 0 |
| Latvia (LV) | 29 | 26 | 29 | -3 |
| Lithuania (LT) | 27 | 28 | 24 | 4 |
| Luxembourg (LU) | 4 | 4 | 4 | 0 |
| Mexico (MX) | 26 | 27 | 25 | 2 |
| Netherlands (NL) | 10 | 11 | 12 | -1 |
| New Zealand (NZ) | 6 | 6 | 6 | 0 |
| Norway (NO) | 19 | 19 | 18 | 1 |
| Poland (PL) | 36 | 36 | 36 | 0 |
| Portugal (PT) | 32 | 32 | 32 | 0 |
| Slovak Republic (SK) | 34 | 33 | 33 | 0 |
| Slovenia (SI) | 28 | 29 | 30 | -1 |
| Spain (ES) | 15 | 15 | 14 | 1 |
| Sweden (SE) | 16 | 16 | 16 | 0 |
| Switzerland (CH) | 1 | 1 | 1 | 0 |
| Turkey (TR) | 24 | 22 | 20 | 2 |
| United Kingdom (GB) | 22 | 21 | 22 | -1 |
| United States (US) | 5 | 5 | 5 | 0 |
Note: This is part of a map series in which we examine each of the five components of our 2019 International Tax Competitiveness Index.