


Comparing Europe’s Tax Systems: Corporate Taxes
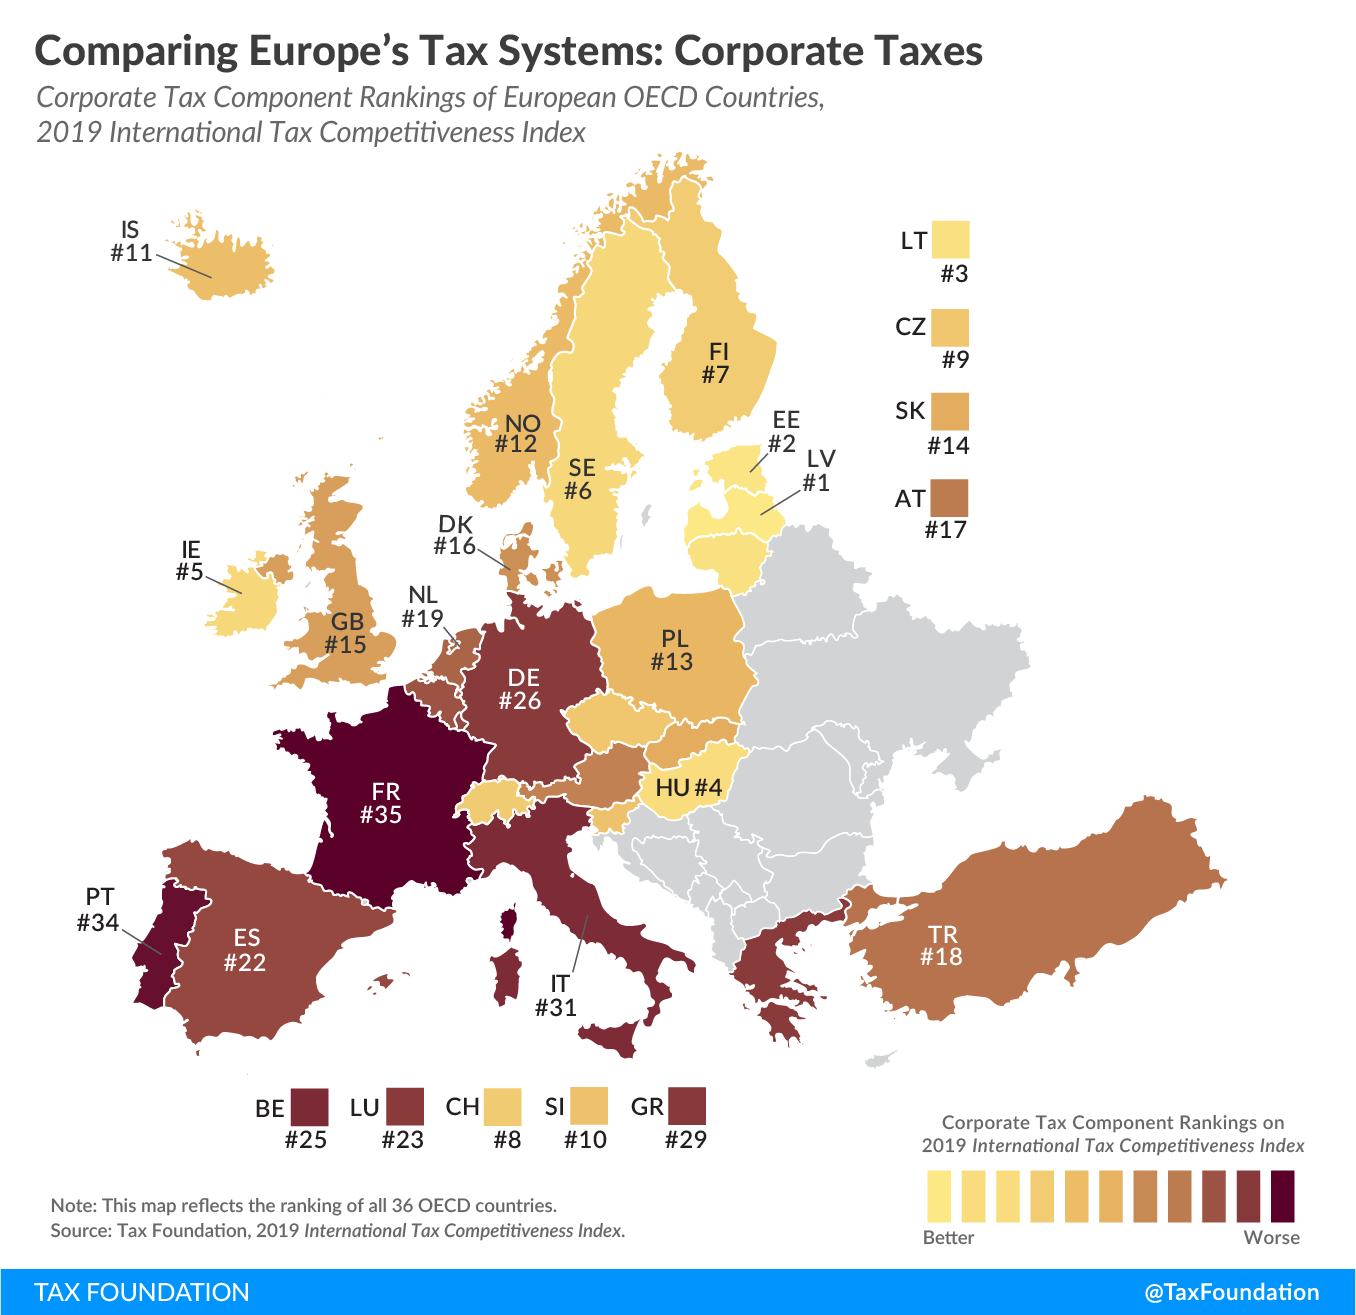
3 min readBy:Last week we released the International Tax Competitiveness Index 2019, a study that measures and compares the competitiveness and neutrality of all 36 OECD countries’ taxA tax is a mandatory payment or charge collected by local, state, and national governments from individuals or businesses to cover the costs of general government services, goods, and activities. systems. In the coming weeks, we will illustrate how European OECD countries rank in each of the five components of the Index: corporate income taxes, individual taxes, consumption taxes, property taxes, and the international tax system. Today we look at how European countries’ corporate income taxA corporate income tax (CIT) is levied by federal and state governments on business profits. Many companies are not subject to the CIT because they are taxed as pass-through businesses, with income reportable under the individual income tax. systems compare within the OECD.
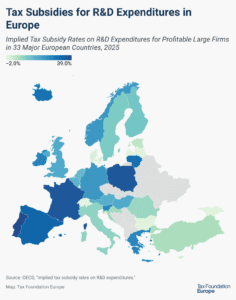
Unlike other studies that compare tax burdens, the Index measures how well a country structures its tax code. A tax code that is competitive and neutral promotes sustainable economic growth and investment while raising sufficient revenue for government priorities. Our corporate income tax component scores countries not only on their corporate tax rates but also on how they handle net operating losses, capital allowances, and inventory valuation, whether distortionary patent boxes and R&D credits are granted, and on the complexity of the corporate income tax.
Click the link below to see an interactive version of OECD countries’ corporate tax rankings, then click on your country for more information about what the strengths and weaknesses of its tax system are and how it compares to the top and bottom five countries in the OECD.
Explore Our New Interactive Tool
Latvia and Estonia have the best corporate tax systems in the OECD. Both countries have a cash-flow tax on business profits. This means that profits only get taxed when they are distributed to shareholders. If a business decides to reinvest its profits instead of paying dividends to shareholders, there is no tax on such profits.
In contrast, France has the least competitive and neutral corporate income tax system in Europe (Japan ranks the lowest in the OECD). At 34.4 percent, France levies the highest corporate tax rate on business profits. Only limited net operating losses can by carried forward and carried back, purchases of machinery, buildings, and intangibles cannot be fully expensed, and a patent boxA patent box—also referred to as intellectual property (IP) regime—taxes business income earned from IP at a rate below the statutory corporate income tax rate, aiming to encourage local research and development. Many patent boxes around the world have undergone substantial reforms due to profit shifting concerns. and an R&D credit create economic distortions.
To see whether your country’s corporate tax rank has improved in recent years, check out the table below. To learn more about how we determined these rankings, read our full methodology here.
| OECD Country | 2017 Rank | 2018 Rank | 2019 Rank | Change from 2018 to 2019 |
|---|---|---|---|---|
| Australia (AU) | 24 | 28 | 28 | 0 |
| Austria (AT) | 16 | 16 | 17 | -1 |
| Belgium (BE) | 28 | 24 | 25 | -1 |
| Canada (CA) | 21 | 22 | 20 | +2 |
| Chile (CL) | 29 | 29 | 30 | -1 |
| Czech Republic (CZ) | 9 | 9 | 9 | 0 |
| Denmark (DK) | 14 | 15 | 16 | -1 |
| Estonia (EE) | 1 | 1 | 2 | -1 |
| Finland (FI) | 7 | 6 | 7 | -1 |
| France (FR) | 36 | 34 | 35 | -1 |
| Germany (DE) | 20 | 25 | 26 | -1 |
| Greece (GR) | 30 | 31 | 29 | +2 |
| Hungary (HU) | 5 | 5 | 4 | +1 |
| Iceland (IS) | 13 | 12 | 11 | +1 |
| Ireland (IE) | 4 | 4 | 5 | -1 |
| Israel (IL) | 27 | 27 | 27 | 0 |
| Italy (IT) | 32 | 30 | 31 | -1 |
| Japan (JP) | 34 | 36 | 36 | 0 |
| Korea (KR) | 25 | 33 | 33 | 0 |
| Latvia (LV) | 3 | 2 | 1 | +1 |
| Lithuania (LT) | 2 | 3 | 3 | 0 |
| Luxembourg (LU) | 26 | 26 | 23 | +3 |
| Mexico (MX) | 31 | 32 | 32 | 0 |
| Netherlands (NL) | 19 | 18 | 19 | -1 |
| New Zealand (NZ) | 22 | 23 | 24 | -1 |
| Norway (NO) | 15 | 13 | 12 | +1 |
| Poland (PL) | 12 | 11 | 13 | -2 |
| Portugal (PT) | 33 | 35 | 34 | +1 |
| Slovak Republic (SK) | 11 | 14 | 14 | 0 |
| Slovenia (SI) | 10 | 10 | 10 | 0 |
| Spain (ES) | 23 | 21 | 22 | -1 |
| Sweden (SE) | 6 | 7 | 6 | +1 |
| Switzerland (CH) | 8 | 8 | 8 | 0 |
| Turkey (TR) | 18 | 19 | 18 | +1 |
| United Kingdom (GB) | 17 | 17 | 15 | +2 |
| United States (US) | 35 | 20 | 21 | -1 |
Taxes make more sense with us in your inbox.
Subscribe to our newsletter for tax insights that cut through the noise—and make sense of it.
Sign UpNote: This is part of a map series in which we examine each of the five components of our International Tax Competitiveness Index 2019.
Share this articleAbout the Author

Elke Asen
Policy Analyst
Elke Asen was a Policy Analyst with the Tax Foundation’s Center for Global Tax Policy, focusing on international tax issues and tax policy in Europe. Prior to joining the Tax Foundation, Elke interned with the EU Delegation in Washington, D.C., the German Development Agency, and a social startup in Munich, Germany. She holds a BS in Economics from Ludwig Maximilian University of Munich.