

New European Commission Report: VAT Gap
3 min readBy:In 2017, Value-Added TaxA tax is a mandatory payment or charge collected by local, state, and national governments from individuals or businesses to cover the costs of general government services, goods, and activities. (VAT) accounted for 62.3 percent of consumption tax revenues in the OECD on average, making it an important source of government revenue.
The European Commission (EC) recently published the latest version of their annual report on the “VAT Gap” in 2018 for the 28 Member States of the European Union at that time.
The VAT Gap refers to the difference between the VAT Total Tax Liability (VTTL) and the VAT revenue that is actually collected. The gap is a measure that reflects VAT avoidance, gaps in enforcement, and unpaid VAT due to bankruptcies.
The report provides VAT Gap estimates for 2018, simplified estimates for 2019, and revised estimates for 2014-2017. It also forecasts the VAT Gap for 2020 and 2021.
In order to estimate the 2018 VAT Gap, the report breaks down the change in nominal VAT revenues into three categories: the change in VTTL (tax baseThe tax base is the total amount of income, property, assets, consumption, transactions, or other economic activity subject to taxation by a tax authority. A narrow tax base is non-neutral and inefficient. A broad tax base reduces tax administration costs and allows more revenue to be raised at lower rates. ), the change in the VAT rate applied to the base, and the change in compliance with the tax. As can be seen in the table below, VAT revenues grew in 2018 from 2017. This change should be primarily attributed to an increase in the tax base, to which the EC attributes 78 percent of growth.
Increased compliance with the VAT contributed to approximately 10 percent of revenue growth, which contributes to a 0.4 percent increase in overall VAT revenue in aggregate.
| Member State | Change in Revenue | Change in VTTL | Change in Base | Change in Effective Rate | Change in Compliance |
|---|---|---|---|---|---|
|
Austria |
3.6% | 4.1% | 3.2% | 0.9% | -0.5% |
|
Belgium |
4.3% | 3.1% | 3.6% | -0.5% | 1.2% |
|
Bulgaria |
9.3% | 7.5% | 8.0% | -0.4% | 1.7% |
|
Croatia |
6.8% | 4.5% | 4.3% | 0.2% | 2.1% |
|
Cyprus |
10.5% | 9.1% | 8.0% | 1.0% | 1.3% |
|
Czechia |
6.5% | 6.6% | 7.8% | -1.1% | -0.1% |
|
Denmark |
4.3% | 3.1% | 3.2% | 0.0% | 1.2% |
|
Estonia |
8.5% | 7.5% | 8.8% | -1.2% | 0.9% |
|
Finland |
4.7% | 3.1% | 3.8% | -0.7% | 1.6% |
|
France |
3.5% | 3.8% | 2.2% | 1.6% | -0.3% |
|
Germany |
3.8% | 3.6% | 3.3% | 0.2% | 0.2% |
|
Greece |
4.4% | -0.2% | -0.6% | 0.5% | 4.6% |
|
Hungary |
13.9% | 7.5% | 9.4% | -1.8% | 5.9% |
|
Ireland |
8.5% | 8.2% | 7.4% | 0.8% | 0.3% |
|
Italy |
1.6% | 1.3% | 2.0% | -0.7% | 0.3% |
|
Latvia |
13.2% | 7.7% | 8.4% | -0.7% | 5.1% |
|
Lithuania |
6.4% | 7.5% | 7.5% | 0.0% | -1.0% |
|
Luxembourg |
8.6% | 11.4% | 5.9% | 5.2% | -2.5% |
|
Malta |
13.5% | 10.1% | 9.8% | 0.3% | 3.1% |
|
Netherlands |
5.6% | 4.9% | 5.2% | -0.3% | 0.7% |
|
Poland |
11.4% | 6.0% | 6.4% | -0.4% | 5.1% |
|
Portugal |
6.3% | 4.7% | 4.0% | 0.6% | 1.5% |
|
Romania |
12.7% | 12.0% | 14.3% | -2.0% | 0.7% |
|
Slovakia |
6.8% | 7.3% | 7.0% | 0.3% | -0.5% |
|
Slovenia |
8.1% | 7.5% | 6.1% | 1.3% | 0.6% |
|
Spain |
4.9% | 4.4% | 3.8% | 0.5% | 0.4% |
|
Sweden |
4.8% | 3.5% | 4.2% | -0.6% | 1.3% |
|
United Kingdom |
4.6% | 5.0% | 4.0% | 1.0% | -0.3% |
|
EU-28 (total) |
4.2% | 3.6% | 3.3% | 0.4% | 0.5% |
|
Source: European Commission, “Study and Reports on the VAT Gap in the EU-28 Member States: 2020 Final Report,” Sep. 2020, https://ec.europa.eu/taxation_customs/sites/taxation/files/vat-gap-full-report-2020_en.pdf. |
|||||
The report estimates that in 2018, VTTL was €1,272 billion (US $1,424 billion) while VAT revenues were €1,132 billion ($1,268 billion), amounting to a €140 billion ($157 billion) loss of VAT revenues.
In 2017, the median VAT Gap in EU countries was 10.9 percent, which decreased to 9.2 percent in 2018.
Only the Czech Republic, France, the United Kingdom, Slovakia, Austria, Lithuania, and Luxembourg experienced growth in the VAT Gap between 2017-2018.
The EC finds downward trends in both the percentage of VTTL left unpaid as well as in the nominal VAT Gap. Hence, the VAT Gap has consistently improved overall.
| Year | % of VTTL | EUR billion | USD billion | |
|---|---|---|---|---|
| 2014 | 14.3 | 162 | 181.411 | |
| 2015 | 13 | 154 | 172.4524 | |
| 2016 | 12.1 | 143 | 160.1344 | |
| 2017 | 11.5 | 141 | 157.8947 | |
| 2018 | 11 | 140 | 156.7749 | |
| 2019 (simplified estimate) | 9.6 | 125 | 139.9776 | |
|
Source: European Commission, “Study and Reports on the VAT Gap in the EU-28 Member States: 2020 Final Report.” |
||||
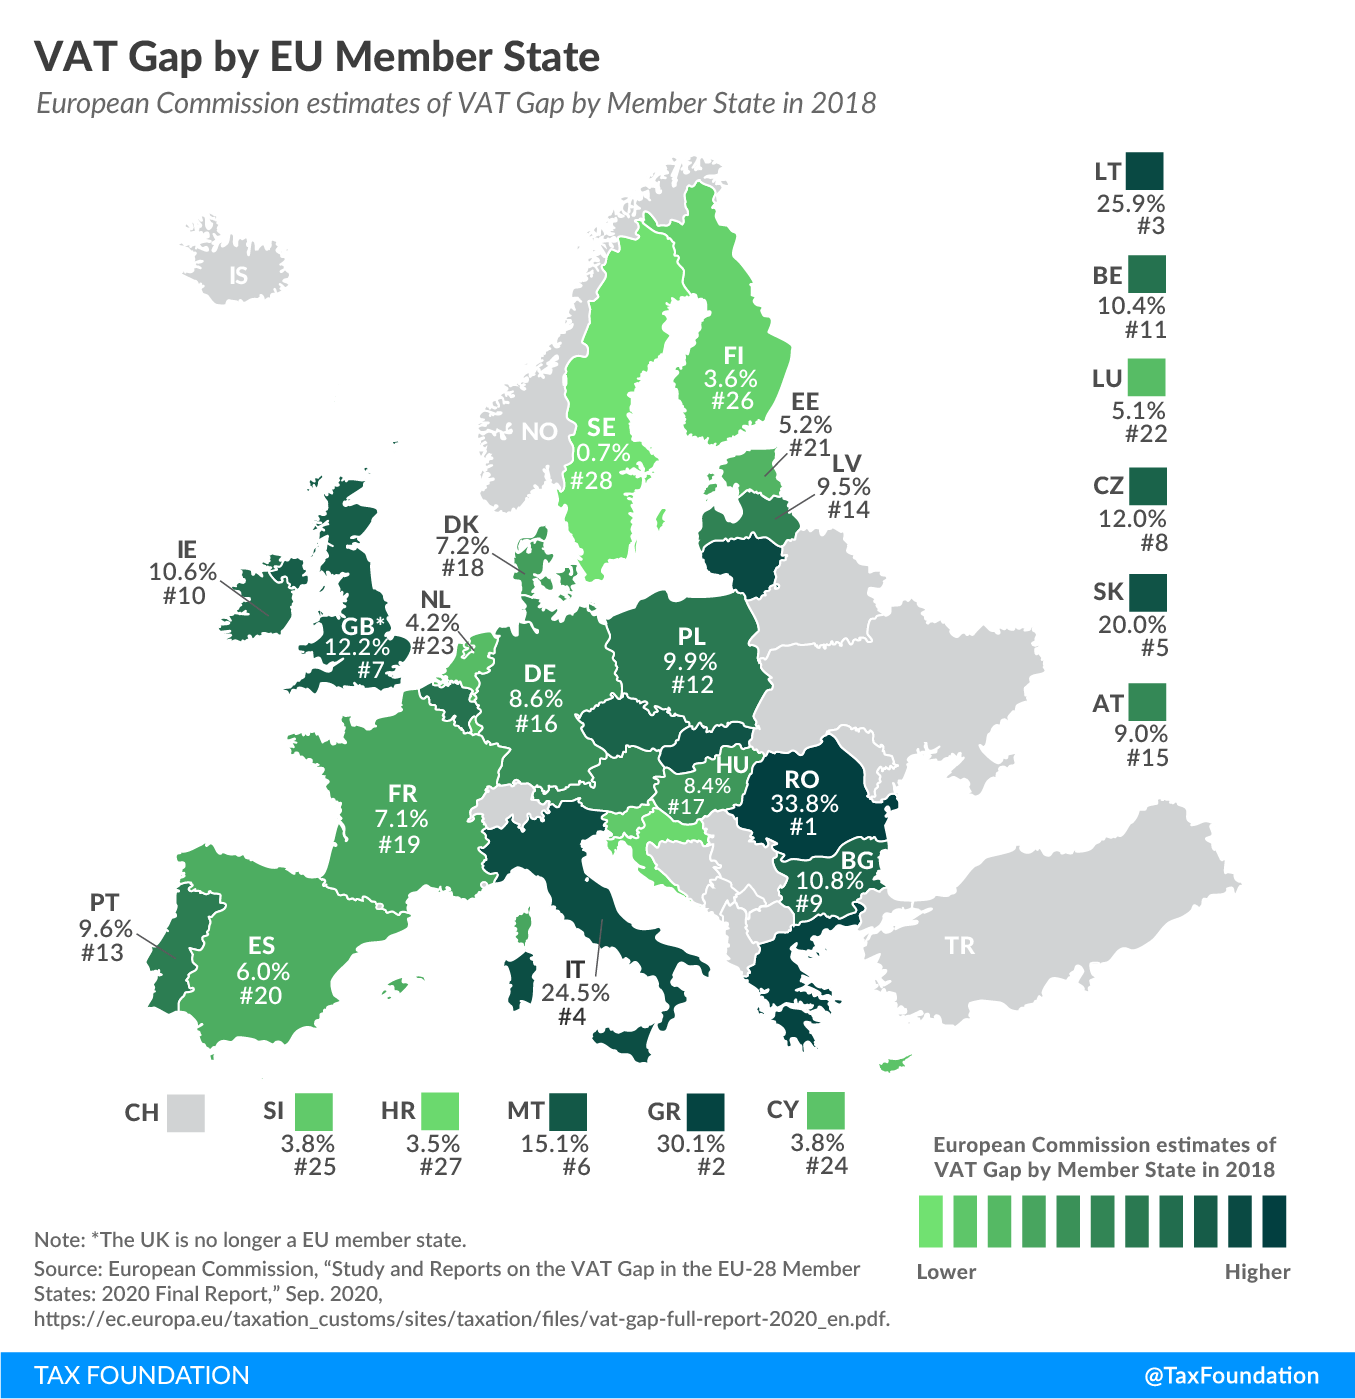
The EU Member States with the greatest percentage of VAT left unpaid are Romania (33.8 percent), Greece (30.1 percent), and Lithuania (25.9 percent). The smallest VAT Gaps occurred in Sweden (0.7 percent), Croatia (3.5 percent), and Finland (3.6 percent).
| Member State | VAT Gap % | VAT Gap (in €mn) | Member State | VAT Gap % | VAT Gap (in €mn) |
|---|---|---|---|---|---|
|
Belgium |
10.4% | 3,617 |
Lithuania |
25.9% | 1,232 |
|
Bulgaria |
10.8% | 614 |
Luxembourg |
5.1% | 199 |
|
Czechia |
12.0% | 2,187 |
Hungary |
8.4% | 1190 |
|
Denmark |
7.2% | 2,248 |
Malta |
15.1% | 164 |
|
Germany |
8.6% | 22,077 |
The Netherlands |
4.2% | 2,278 |
|
Estonia |
5.2% | 127 |
Austria |
9.0% | 2,908 |
|
Ireland |
10.6% | 1,682 |
Poland |
9.9% | 4,451 |
|
Greece |
30.1% | 6570 |
Portugal |
9.6% | 1,889 |
|
Spain |
6.0% | 4,909 |
Romania |
33.8% | 6,595 |
|
France |
7.1% | 12,788 |
Slovenia |
3.8% | 148 |
|
Croatia |
3.5% | 252 |
Slovakia |
20.0% | 1,579 |
|
Italy |
24.5% | 35,439 |
Finland |
3.6% | 807 |
|
Cyprus |
3.8% | 77 |
Sweden |
0.7% | 306 |
|
Latvia |
9.5% | 256 |
United Kingdom |
12.2% | 23,452 |
|
Source: European Commission, “Study and Reports on the VAT Gap in the EU-28 Member States: 2020 Final Report.” |
|||||
The report also forecasts that VAT non-compliance will rise as a result of the COVID-19 pandemic. This will coincide with the current contraction in consumption, which is depressing VAT revenues. The report estimates an economic contraction of 7.4 percent of GDP in 2020, followed by GDP growth of 6.1 percent in 2021.
The recessionA recession is a significant and sustained decline in the economy. Typically, a recession lasts longer than six months, but recovery from a recession can take a few years. is expected to increase the VAT Gap by 4.1 percent, from 9.6 percent in 2019 to 13.7 percent. The EC estimates an incomplete economic recovery in 2021, meaning that the VAT Gap is unlikely to return to 2019 levels.
Just as COVID-19 is putting pressure on other sources of revenue, the loss of VAT revenues resulting from the crisis will force governments to evaluate their VAT systems.
Stay informed on the tax policies impacting you.
Subscribe to get insights from our trusted experts delivered straight to your inbox.
Subscribe