According to preliminary 2015 data, state and local pension debt now exceeds a combined $1.5 trillion. Strong returns on investment (averaging 17 percent in 2014) have helped to reduce the debt, but the message is still clear: many states are facing a pension crisis.
States vary in the way they structure their pension systems, but some states are transitioning new employees into defined contribution or hybrid plans rather than more traditional, and more costly, defined benefit plans. Defined contribution plans give employees control of their own investment account, while defined benefit plans promise employees a lifetime annuity. This move toward defined contribution plans can be a step toward fiscally sound pension plans for states; however, it doesn’t address existing pension debt.
This week’s map uses data from The Pew Charitable Trusts that measure the funded ratio of public pension plans by state. The funded ratio measures the level of assets in proportion to accrued liability. Low funded ratios indicate the state’s pension plans are not currently adequately funded. Low funding levels are challenging not only because of the large contributions required to make up the debt, but also because they generate less in investment earnings.
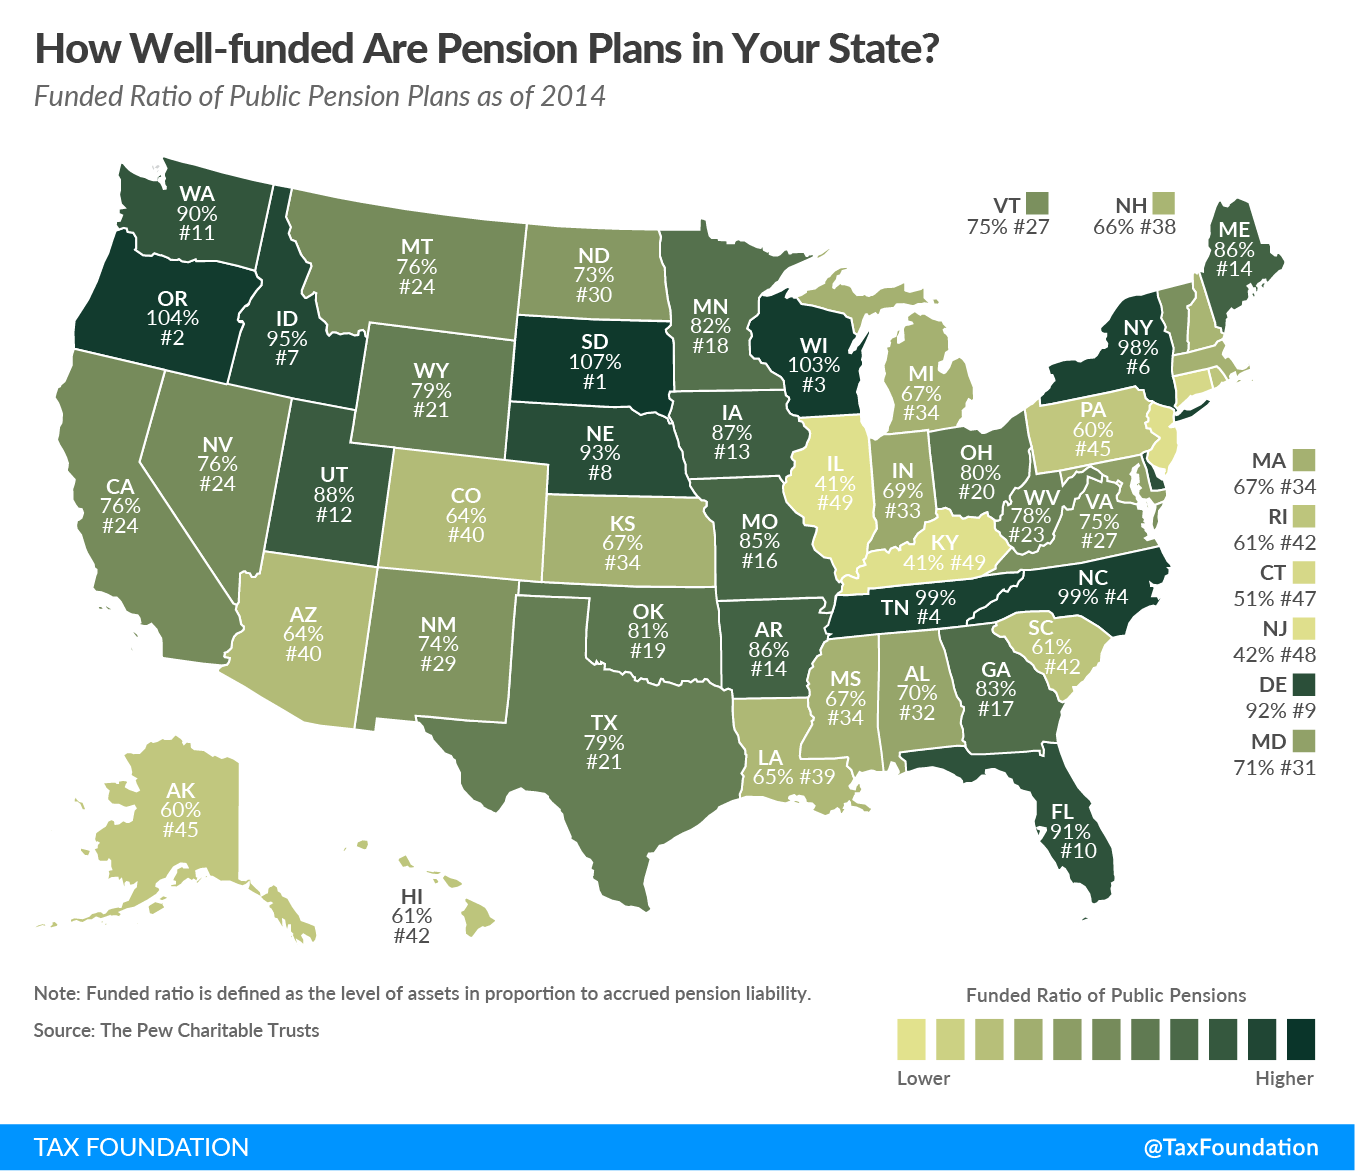
Both Kentucky and Illinois have a funded ratio of 41 percent and are tied for the lowest funded ratio in the country. On the other end of the spectrum, three states – South Dakota (107 percent), Oregon (102 percent), and Wisconsin (103 percent) – have funded ratios above 100 percent.
Pension obligations must be fulfilled eventually. Policymakers should consider that reform now may be less costly and less painful than coping with a larger crisis later.
Share this article