

Key Findings
-
This report compares top effective marginal taxA tax is a mandatory payment or charge collected by local, state, and national governments from individuals or businesses to cover the costs of general government services, goods, and activities. rates on labour income in 41 OECD and EU countries.
-
The top effective marginal tax rateThe marginal tax rate is the amount of additional tax paid for every additional dollar earned as income. The average tax rate is the total tax paid divided by total income earned. A 10 percent marginal tax rate means that 10 cents of every next dollar earned would be taken as tax. is the total tax paid on the last dollar earned by a high-earning worker, taking social security contributions and consumption taxA consumption tax is typically levied on the purchase of goods or services and is paid directly or indirectly by the consumer in the form of retail sales taxes, excise taxes, tariffs, value-added taxes (VAT), or an income tax where all savings is tax-deductible. es into account in addition to income taxes. It is a measure of the degree of progressivity and redistribution in the tax system. As such, it is of great policy interest.
-
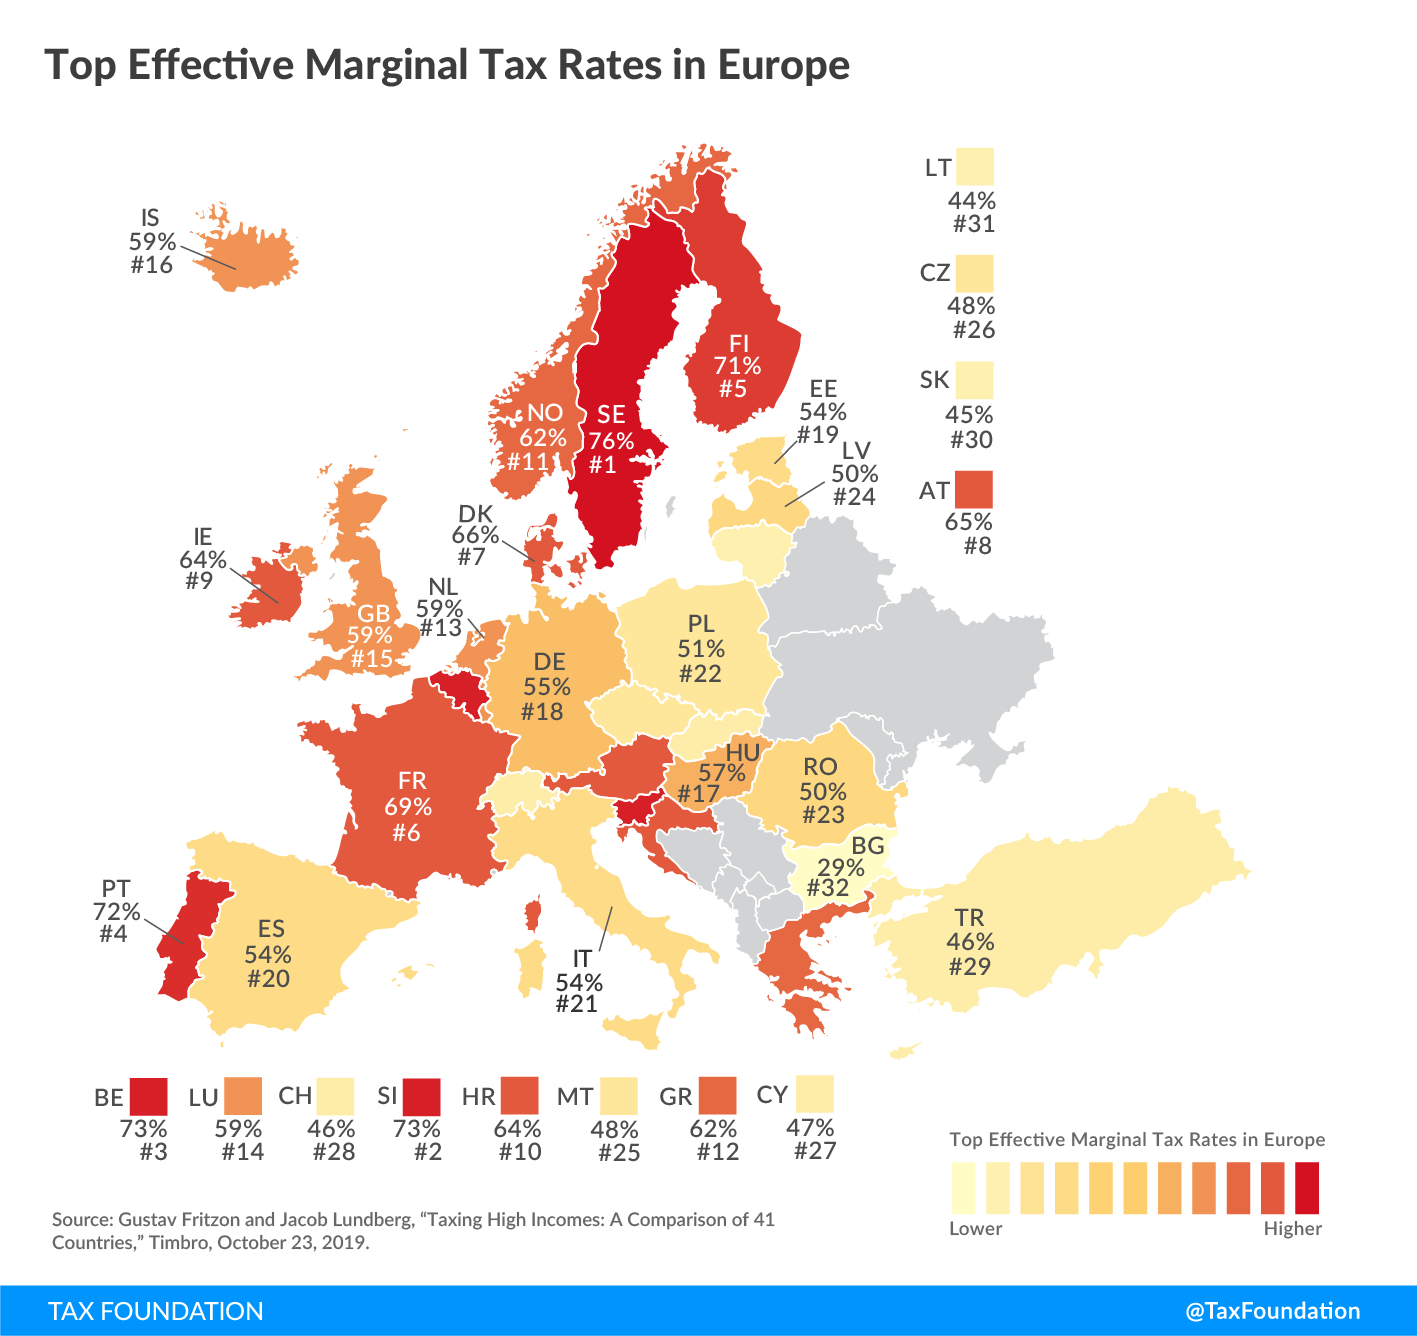
The highest marginal tax rate is found in Sweden, 76 percent, and the lowest in Bulgaria, 29 percent.
-
In general, the Nordic and the Western European countries have the highest effective tax rates.
Introduction
High marginal tax rates on personal income have received renewed interest in recent years. For example, left-of-centre economists Emmanuel Saez and Thomas Piketty have proposed raising taxes on high earners to 80 percent (Saez & Piketty, 2013). American Congresswoman Alexandria Ocasio-Cortez has suggested a 70 percent top marginal tax rate (Kapur, 2019). The taxation of high-income earners is indicative of the overall level of redistribution in the tax system and of the magnitude of distortions the system causes. As such, it is perhaps the prime example of the conflict—central in public economics—between efficiency and equity in tax systems. Top marginal tax rates are therefore the subject of much academic interest (e.g., Saez, 2001).
The political discussion around taxing high-earners usually revolves around the income tax, but in order to get a complete picture of the tax burden high-income earners face, it is important to consider effective marginal tax rates. The effective marginal tax rate answers the question, “If a worker gets a raise such that the total cost to the employer increases by one dollar, how much of that is appropriated by the government in the form of income tax, social security contributions, and consumption taxes?” In principle, it does not matter how the tax burden is distributed among the various taxes—all taxes that affect the return to work should be taken into account.
Despite their policy importance, data on effective marginal tax rates is not readily available, since they are complicated to research and compute. To our knowledge, this is the only recent comprehensive compilation of top effective marginal tax rates in advanced economies.[1] Combining data mainly from international accounting firms, the OECD, and the European Commission, we are able to calculate marginal tax rates in the 41 members of the OECD and/or EU. The methodology is described below.
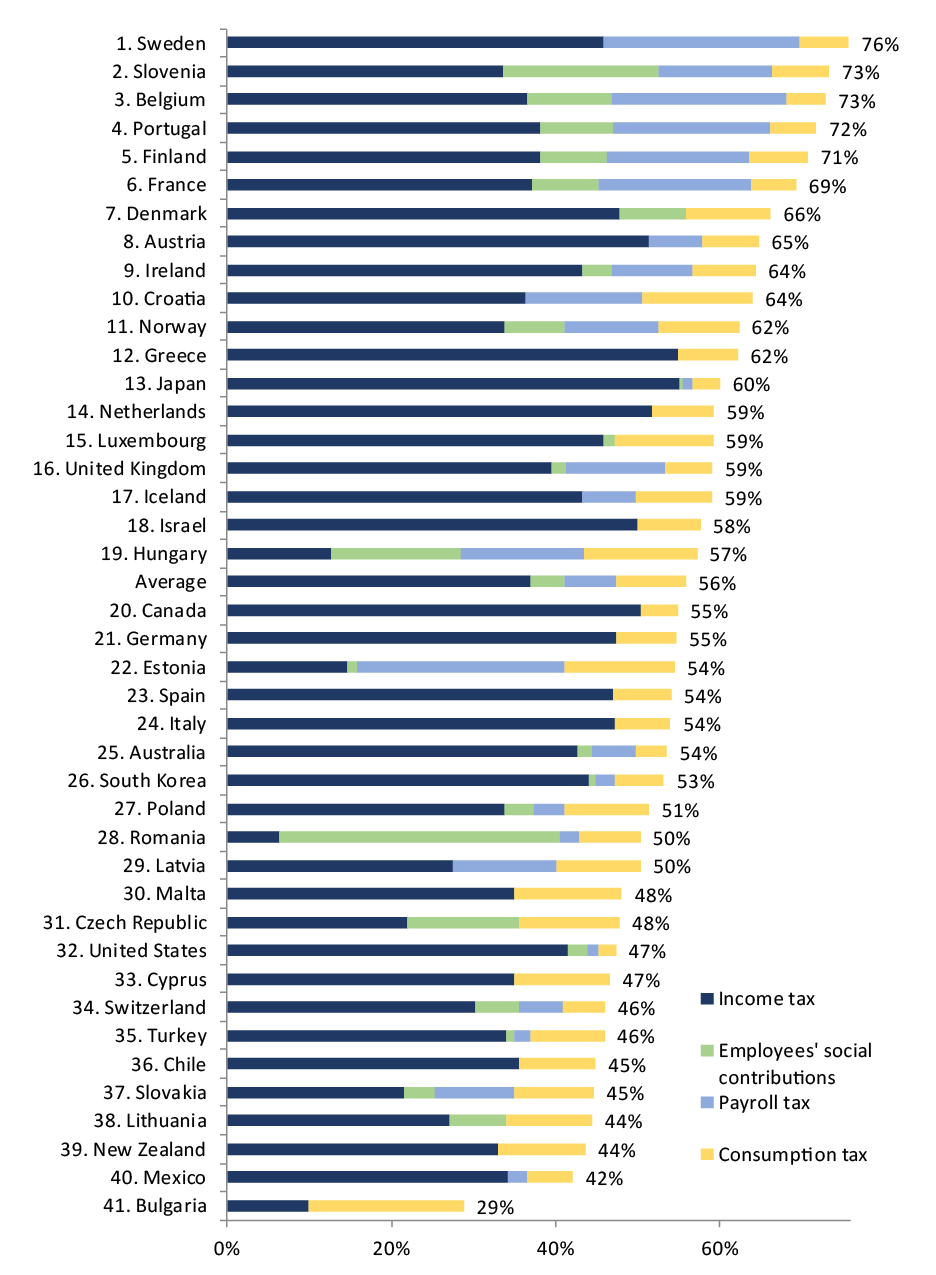
The full country ranking is shown in Figure 1. There is wide variation in the effective marginal tax rates: from Bulgaria, at 29 percent, to Sweden, at 76 percent. Twenty-eight countries have effective marginal tax rates higher than 50 percent. The average of all countries is 56 percent. Regional differences are analyzed in more detail in the next section.
Countries should be cautious about placing excessive tax burdens on high-income earners, for several reasons. In the short run, high marginal tax rates induce tax avoidance and tax evasion, and can cause high-income earners to reduce their work effort or hours. Under reasonable assumptions about behavioural responses to taxation, the Laffer curve—which shows the relationship between the tax rate and tax revenues—peaks around 60-75 percent for high incomes. This implies that many OECD countries are close to the tax revenue peak or have surpassed it (Lundberg, 2017a). In the long run, high marginal tax rates can affect career choices and migration decisions. They also lower the return to education and entrepreneurship.
Governments differ in the type of taxes they levy (see Table 1 below). All countries in the sample have a central income tax and some sort of consumption tax (state sales taxes in the United States and VAT in all other countries), but apart from that, they do not have much in common in how they tax high-income earners. Eleven countries impose local or regional income taxes and 12 have solidarity contributions or similar surtaxA surtax is an additional tax levied on top of an already existing business or individual tax and can have a flat or progressive rate structure. Surtaxes are typically enacted to fund a specific program or initiative, whereas revenue from broader-based taxes, like the individual income tax, typically cover a multitude of programs and services. es on high incomes. Twenty-three levy uncapped social security contributions on employees and 26 on employers.
This underscores the need to consider the full spectrum of taxes when comparing marginal tax burdens across countries. For example, Hungary has a flat income tax of 15 percent while the United States has a progressive federal income tax with a top marginal tax rate of 37 percent. As payroll and consumption taxes are low in the United States, the effective marginal tax rate is not much higher, at 47 percent. In Hungary, on the other hand, substantial social security contributions are paid by both employers and employees. In addition, the country has the world’s highest VAT. The result is an effective tax rate of 57 percent—13 places higher than the United States in the country rankings.
The six countries with the highest effective marginal tax rates all have high payroll taxA payroll tax is a tax paid on the wages and salaries of employees to finance social insurance programs like Social Security, Medicare, and unemployment insurance. Payroll taxes are social insurance taxes that comprise 24.8 percent of combined federal, state, and local government revenue, the second largest source of that combined tax revenue. es. This is in contrast to most countries, where for high-income earners payroll taxes are low or zero at the margin, as the social security benefits that they are often associated with have earnings ceilings. The levying of high payroll taxes has been criticized as a way of obfuscating true tax burdens, as payroll taxes are not included in taxable incomeTaxable income is the amount of income subject to tax, after deductions and exemptions. For both individuals and corporations, taxable income differs from—and is less than—gross income. and typically not reported to employees (Sanandaji & Wallace, 2011).
Countries also differ in where the top marginal tax rate starts to apply. Mapping this would be very complicated, as taxes may have different thresholds. For example, the threshold for solidarity taxes may be different than for the top income tax bracketA tax bracket is the range of incomes taxed at given rates, which typically differ depending on filing status. In a progressive individual or corporate income tax system, rates rise as income increases. There are seven federal individual income tax brackets; the federal corporate income tax system is flat. . It should also be noted that the top marginal tax rate is by no means always the highest tax rate, since social security contributions often only apply up to a ceiling.
Figure 1 Top Effective Marginal Tax Rates in 2019 and Their Composition
|
See methodology and country notes in full report for details. * Average tax rate on consumption in 2017, as a percentage of tax-inclusive prices. Source: Own calculations based on PwC (2019), KPMG (2019b, 2019c), European Commission (2019), OECD (2019a) and country-specific sources (see country notes). |
||||||||
| Country | Income tax | Employee social contributions | Payroll tax | Consumption tax* | Effective marginal tax rate | |||
|---|---|---|---|---|---|---|---|---|
| Central | Local/regional | Surtaxes | Deductible | Nondeductible | ||||
| Australia | 45 | 2 | 5.52 | 7.6 | 53.6 | |||
| Austria | 55 | 6.9 | 16.2 | 64.7 | ||||
| Belgium | 50 | 3.5 | 13.07 | 27.13 | 14.6 | 72.9 | ||
| Bulgaria | 10 | 20.9 | 28.8 | |||||
| Canada | 33 | 17.46 | 8.9 | 54.9 | ||||
| Chile | 35.5 | 0.02 | 14.5 | 44.9 | ||||
| Croatia | 36 | 6.48 | 16.5 | 27.0 | 64.0 | |||
| Cyprus | 35 | 17.9 | 46.6 | |||||
| Czech Republic | 15 | 7 | 13.5 | 19.0 | 47.8 | |||
| Denmark | 52.05 | 8 | 23.4 | 66.2 | ||||
| Estonia | 20 | 1.6 | 33.8 | 22.6 | 54.5 | |||
| Finland | 31.25 | 19.88 | 8.25 | 20.32 | 19.7 | 70.1 | ||
| France | 45 | 4 | 7.2 | 2.9 | 22.67 | 15.2 | 69.3 | |
| Germany | 45 | 2.475 | 13.8 | 54.7 | ||||
| Greece | 45 | 10 | 16.0 | 62.2 | ||||
| Hungary | 15 | 18.5 | 17.5 | 24.3 | 57.2 | |||
| Iceland | 31.8 | 14.44 | 6.85 | 18.6 | 59.0 | |||
| Ireland | 40 | 8 | 4 | 10.95 | 17.6 | 64.3 | ||
| Israel | 47 | 3 | 15.3 | 57.6 | ||||
| Italy | 43 | 4.23 | 12.9 | 54.0 | ||||
| Japan | 45 | 10 | 0.945 | 0.3 | 1.19 | 7.9 | 60.0 | |
| Latvia | 23 | 8.47 | 14.09 | 17.0 | 50.2 | |||
| Lithuania | 27 | 6.98 | 15.9 | 44.5 | ||||
| Luxembourg | 42 | 3.78 | 1.4 | 22.7 | 59.2 | |||
| Malta | 35 | 20.1 | 48.1 | |||||
| Mexico | 35 | 2.49 | 8.7 | 42.1 | ||||
| Netherlands | 51.75 | 15.6 | 59.3 | |||||
| New Zealand | 33 | 15.9 | 43.6 | |||||
| Norway | 38.2 | 8.2 | 13 | 20.6 | 62.3 | |||
| Poland | 32 | 2.45 | 1.219 | 3.81 | 17.5 | 48.3 | ||
| Portugal | 48 | 5 | 11 | 23.75 | 16.5 | 71.8 | ||
| Romania | 10 | 35 | 2.25 | 13.1 | 50.3 | |||
| Slovakia | 25 | 4 | 10.8 | 14.8 | 44.7 | |||
| Slovenia | 50 | 22.1 | 16.1 | 20.5 | 73.3 | |||
| South Korea | 41.16 | 4.12 | 0.65 | 2.6 | 11.3 | 53.2 | ||
| Spain | 22.5 | 24.61 | 13.2 | 54.1 | ||||
| Sweden | 25 | 32.19 | 3 | 31.42 | 19.8 | 75.7 | ||
| Switzerland | 11.5 | 22.39 | 5.625 | 5.625 | 8.6 | 46.0 | ||
| Turkey | 35 | 1 | 2 | 14.3 | 45.9 | |||
| United Kingdom | 45 | 2 | 13.8 | 12.2 | 59.1 | |||
| United States | 37 | 5.08 | 2.35 | 1.45 | 3.8 | 47.3 | ||
Stay informed on the tax policies impacting you.
Subscribe to get insights from our trusted experts delivered straight to your inbox.
Subscribe[1] This report is an updated version of Fritz Englund & Lundberg (2017), which compared top marginal tax rates in 31 countries. OECD (2019a) calculates effective marginal tax rates, but not for top incomes and excluding consumption taxes.
Share