


Actionable VAT Policy Gap in Europe, 2021
4 min readBy:Value-added taxes (VAT) make up approximately one-fifth of total taxA tax is a mandatory payment or charge collected by local, state, and national governments from individuals or businesses to cover the costs of general government services, goods, and activities. revenues in Europe. However, European countries differ significantly in how efficiently they raise VAT revenues. One way to measure a country’s VAT efficiency is the VAT Gap. This measure looks at the difference between VAT revenue actually collected and collectable VAT revenue under an ideal VAT that applied at the standard rate on all final consumption. The difference in actual and potential VAT revenues is due to 1) lacking VAT compliance (the “compliance gap”), and 2) policy choices to exempt certain goods and services from VAT or tax them at a reduced rate (the “policy gap”).
Today’s map will focus on the latter, showing the additional VAT revenue that could theoretically be generated if lawmakers decided to apply a uniform VAT rate on the final domestic use of all goods and services. This policy gap is made up of two components: the rate gap and the exemption gap. The rate gap represents the loss in VAT revenue due to reduced VAT rates, and the exemption gap is due to certain goods and services being exempt from VAT.
However, there are certain services—namely, imputed rents, the provision of public goods, and financial services—that are VAT-exempt for various reasons; it would be difficult to levy VAT on them. Subtracting the gap caused by these services from the general policy gap leaves us with the actionable policy gap (equaling the actionable exemption gap plus the rate gap), which is the amount of additional VAT revenue lawmakers could realistically raise by eliminating reduced rates as well as certain exemptions.
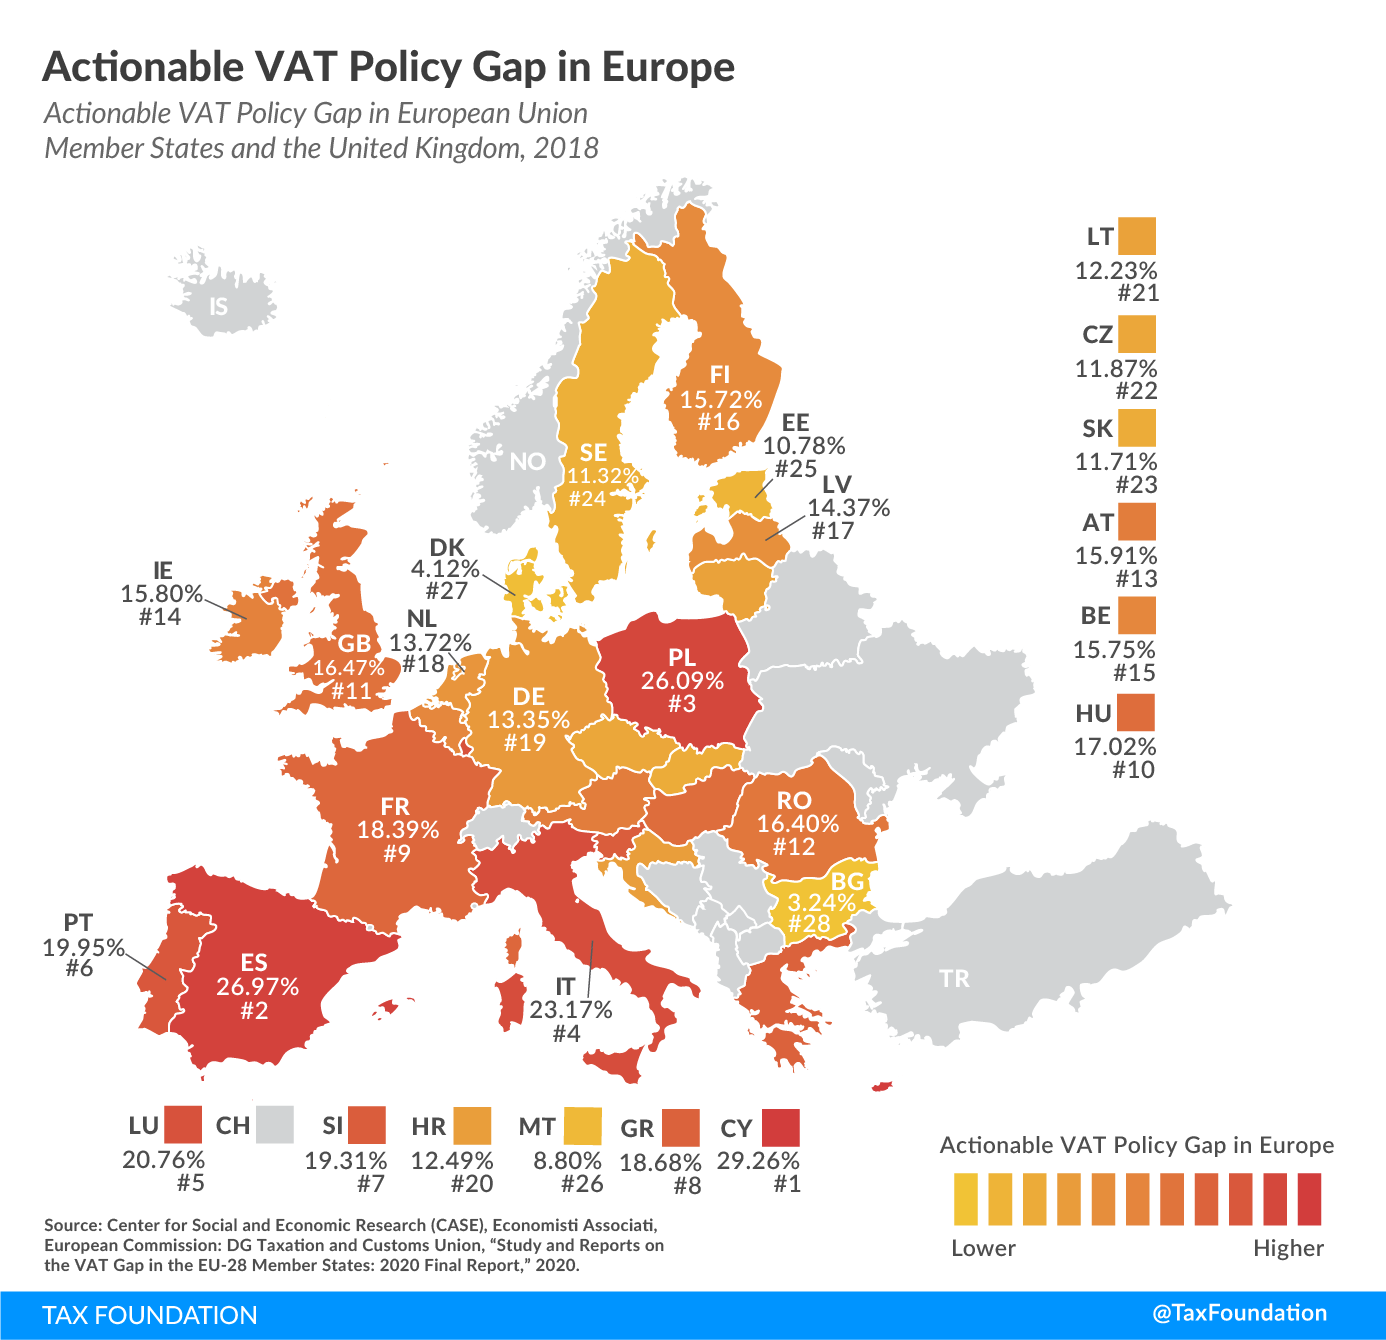
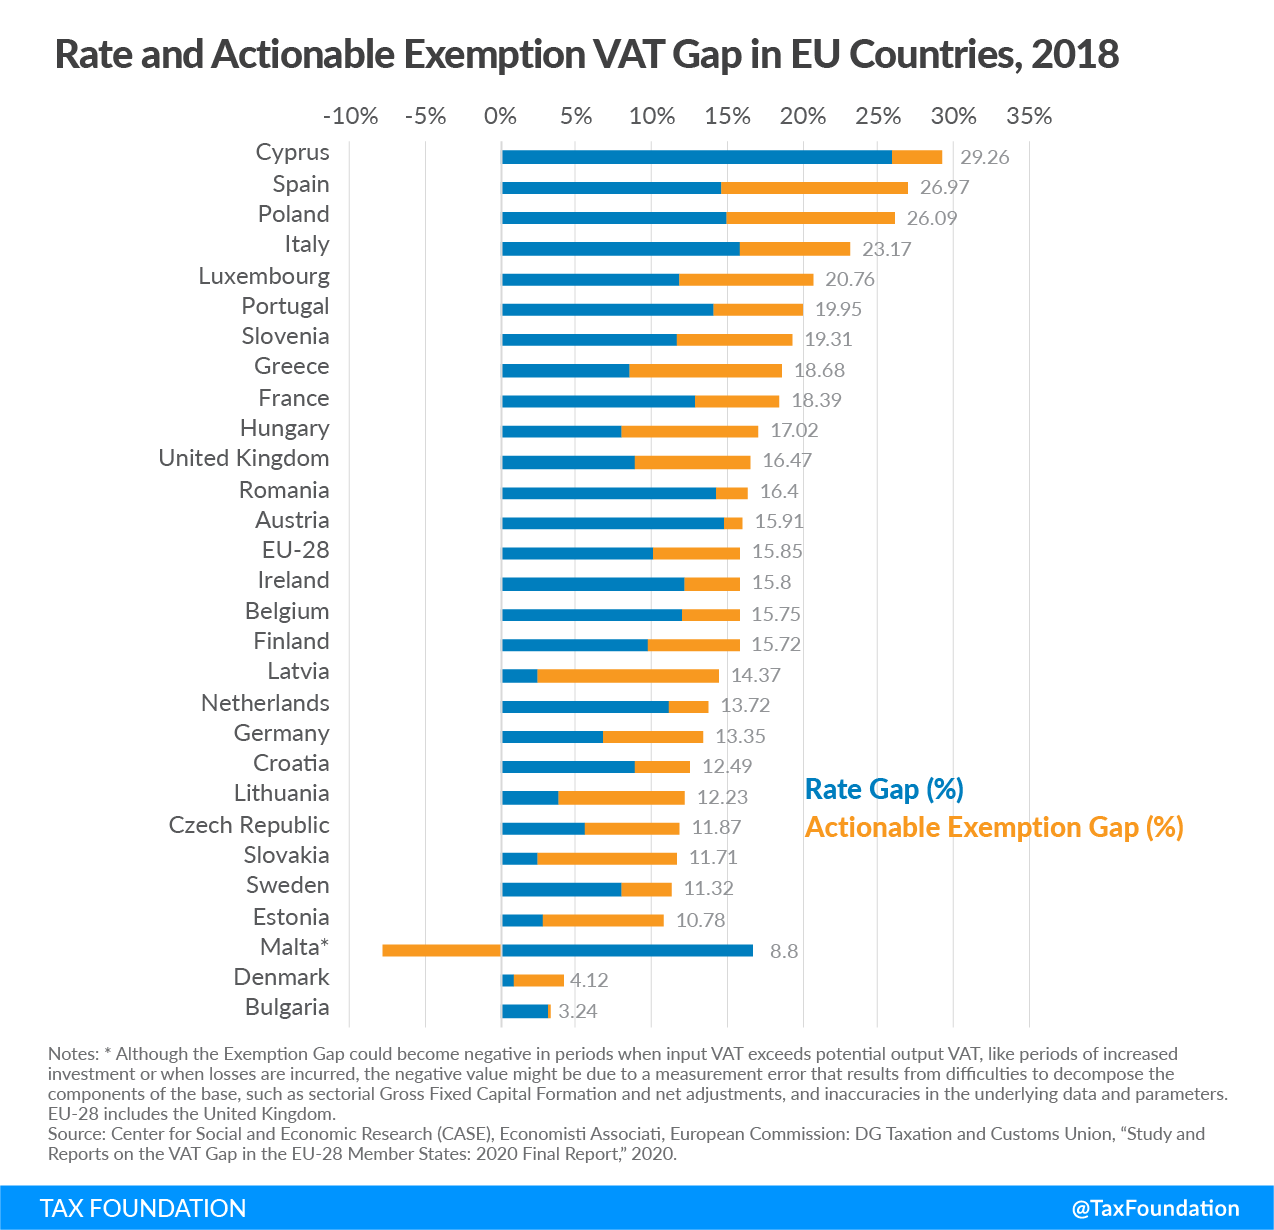
The average actionable policy gap for the European Union was 15.84 percent in 2018, of which 10.07 percentage points can be attributed to reduced rates (rate gap) and 5.77 percentage points to the actionable portion of the exemption gap.
The rate gap is smallest in countries that have few reduced rates, such as Denmark (0.77 percent rate gap), Slovakia (2.34 percent), and Latvia (2.37 percent). On the other hand, rate gaps were highest in Cyprus (25.97 percent), Malta (16.60 percent), and Italy (15.86 percent). The highest actionable exemption gaps were observed in Spain (12.40 percent), Latvia (12.00 percent), and Poland (11.18).
| Actionable Policy Gap (%) | Rate Gap (%) | Actionable Exemption Gap (%) | |
|---|---|---|---|
| Austria (AT) | 15.91 | 14.76 | 1.15 |
| Belgium (BE) | 15.75 | 11.91 | 3.84 |
| Bulgaria (BG) | 3.24 | 3.18 | 0.06 |
| Croatia (HR) | 12.49 | 8.82 | 3.68 |
| Cyprus (CY) | 29.26 | 25.97 | 3.29 |
| Czech Republic (CZ) | 11.87 | 5.57 | 6.31 |
| Denmark (DK) | 4.12 | 0.77 | 3.35 |
| Estonia (EE) | 10.78 | 2.68 | 8.10 |
| Finland (FI) | 15.72 | 9.73 | 6.00 |
| France (FR) | 18.39 | 12.93 | 5.47 |
| Germany (DE) | 13.35 | 6.76 | 6.58 |
| Greece (EL) | 18.68 | 8.44 | 10.24 |
| Hungary (HU) | 17.02 | 8.01 | 9.01 |
| Ireland (IE) | 15.80 | 12.23 | 3.57 |
| Italy (IT) | 23.17 | 15.86 | 7.31 |
| Latvia (LV) | 14.37 | 2.37 | 12.00 |
| Lithuania (LT) | 12.23 | 3.83 | 8.40 |
| Luxembourg (LU) | 20.76 | 11.86 | 8.90 |
| Malta (MT)* | 8.80 | 16.60 | -7.80 |
| Netherlands (NL) | 13.72 | 11.16 | 2.56 |
| Poland (PL) | 26.09 | 14.91 | 11.18 |
| Portugal (PT) | 19.95 | 14.11 | 5.84 |
| Romania (RO) | 16.40 | 14.23 | 2.17 |
| Slovakia (SK) | 11.71 | 2.34 | 9.37 |
| Slovenia (SI) | 19.31 | 11.71 | 7.60 |
| Spain (ES) | 26.97 | 14.57 | 12.40 |
| Sweden (SE) | 11.32 | 7.90 | 3.42 |
| United Kingdom (UK) | 16.47 | 8.78 | 7.68 |
| EU-28 | 15.84 | 10.07 | 5.77 |
|
Note: *Although the exemption gap could become negative in periods when input VAT exceeds potential output VAT, like periods of increased investment or when losses are incurred, the negative value might be due to a measurement error that results from difficulties in decomposing the components of the base, such as sectorial Gross Fixed Capital Formation and net adjustments, and inaccuracies in the underlying data and parameters. Source: Center for Social and Economic Research (CASE), Economisti Associati, European Commission: DG Taxation and Customs Union, 2020, “Study and Reports on the VAT Gap in the EU-28 Member States: 2020 Final Report,” European Union, Publications Office of the European Union. |
|||