Today we continue our map series on the 2023 State Business Tax Climate Index with a map showing states’ rankings on the Index’s sales and excise tax component. The sales tax rate and structure can make a state more or less attractive to businesses for two key reasons: (1) some states apply the sales taxA tax is a mandatory payment or charge collected by local, state, and national governments from individuals or businesses to cover the costs of general government services, goods, and activities. to business inputs, which drives up the costs of production, and (2) as sales taxA sales tax is levied on retail sales of goods and services and, ideally, should apply to all final consumption with few exemptions. Many governments exempt goods like groceries; base broadening, such as including groceries, could keep rates lower. A sales tax should exempt business-to-business transactions which, when taxed, cause tax pyramiding. rates increase, consumers may cut back on purchases or move their shopping to lower-tax jurisdictions. The sales tax component accounts for 23.5 percent of each state’s overall Index score.
An ideal sales tax applies to a broad base of final consumer goods and services, with few exemptions, and is levied at a low rate. Broad-based, low-rate tax structures minimize tax-induced economic distortions that can occur when people change their purchasing behavior because of tax differences. In addition, sales tax exemptions narrow the tax base, driving up the sales tax rate on those goods and services that remain subject to the tax or forcing greater reliance on less economically efficient taxes.
It is important to note that a well-structured sales tax applies only to the final consumer at the point of sale. It does not apply to the sale of machinery, raw materials, and other business inputs, as those taxes increase the costs of production and ultimately get passed along to consumers in the form of higher prices. States that avoid taxing business inputs perform better on the Index.
This section of the Index also looks at how states apply their sales taxes to remote sellers. While most states have adopted appropriate safe harbors for small sellers and have a single point of administration for all state and local sales taxes, a few are penalized because they diverge from these practices, imposing substantial compliance costs on out-of-state retailers.
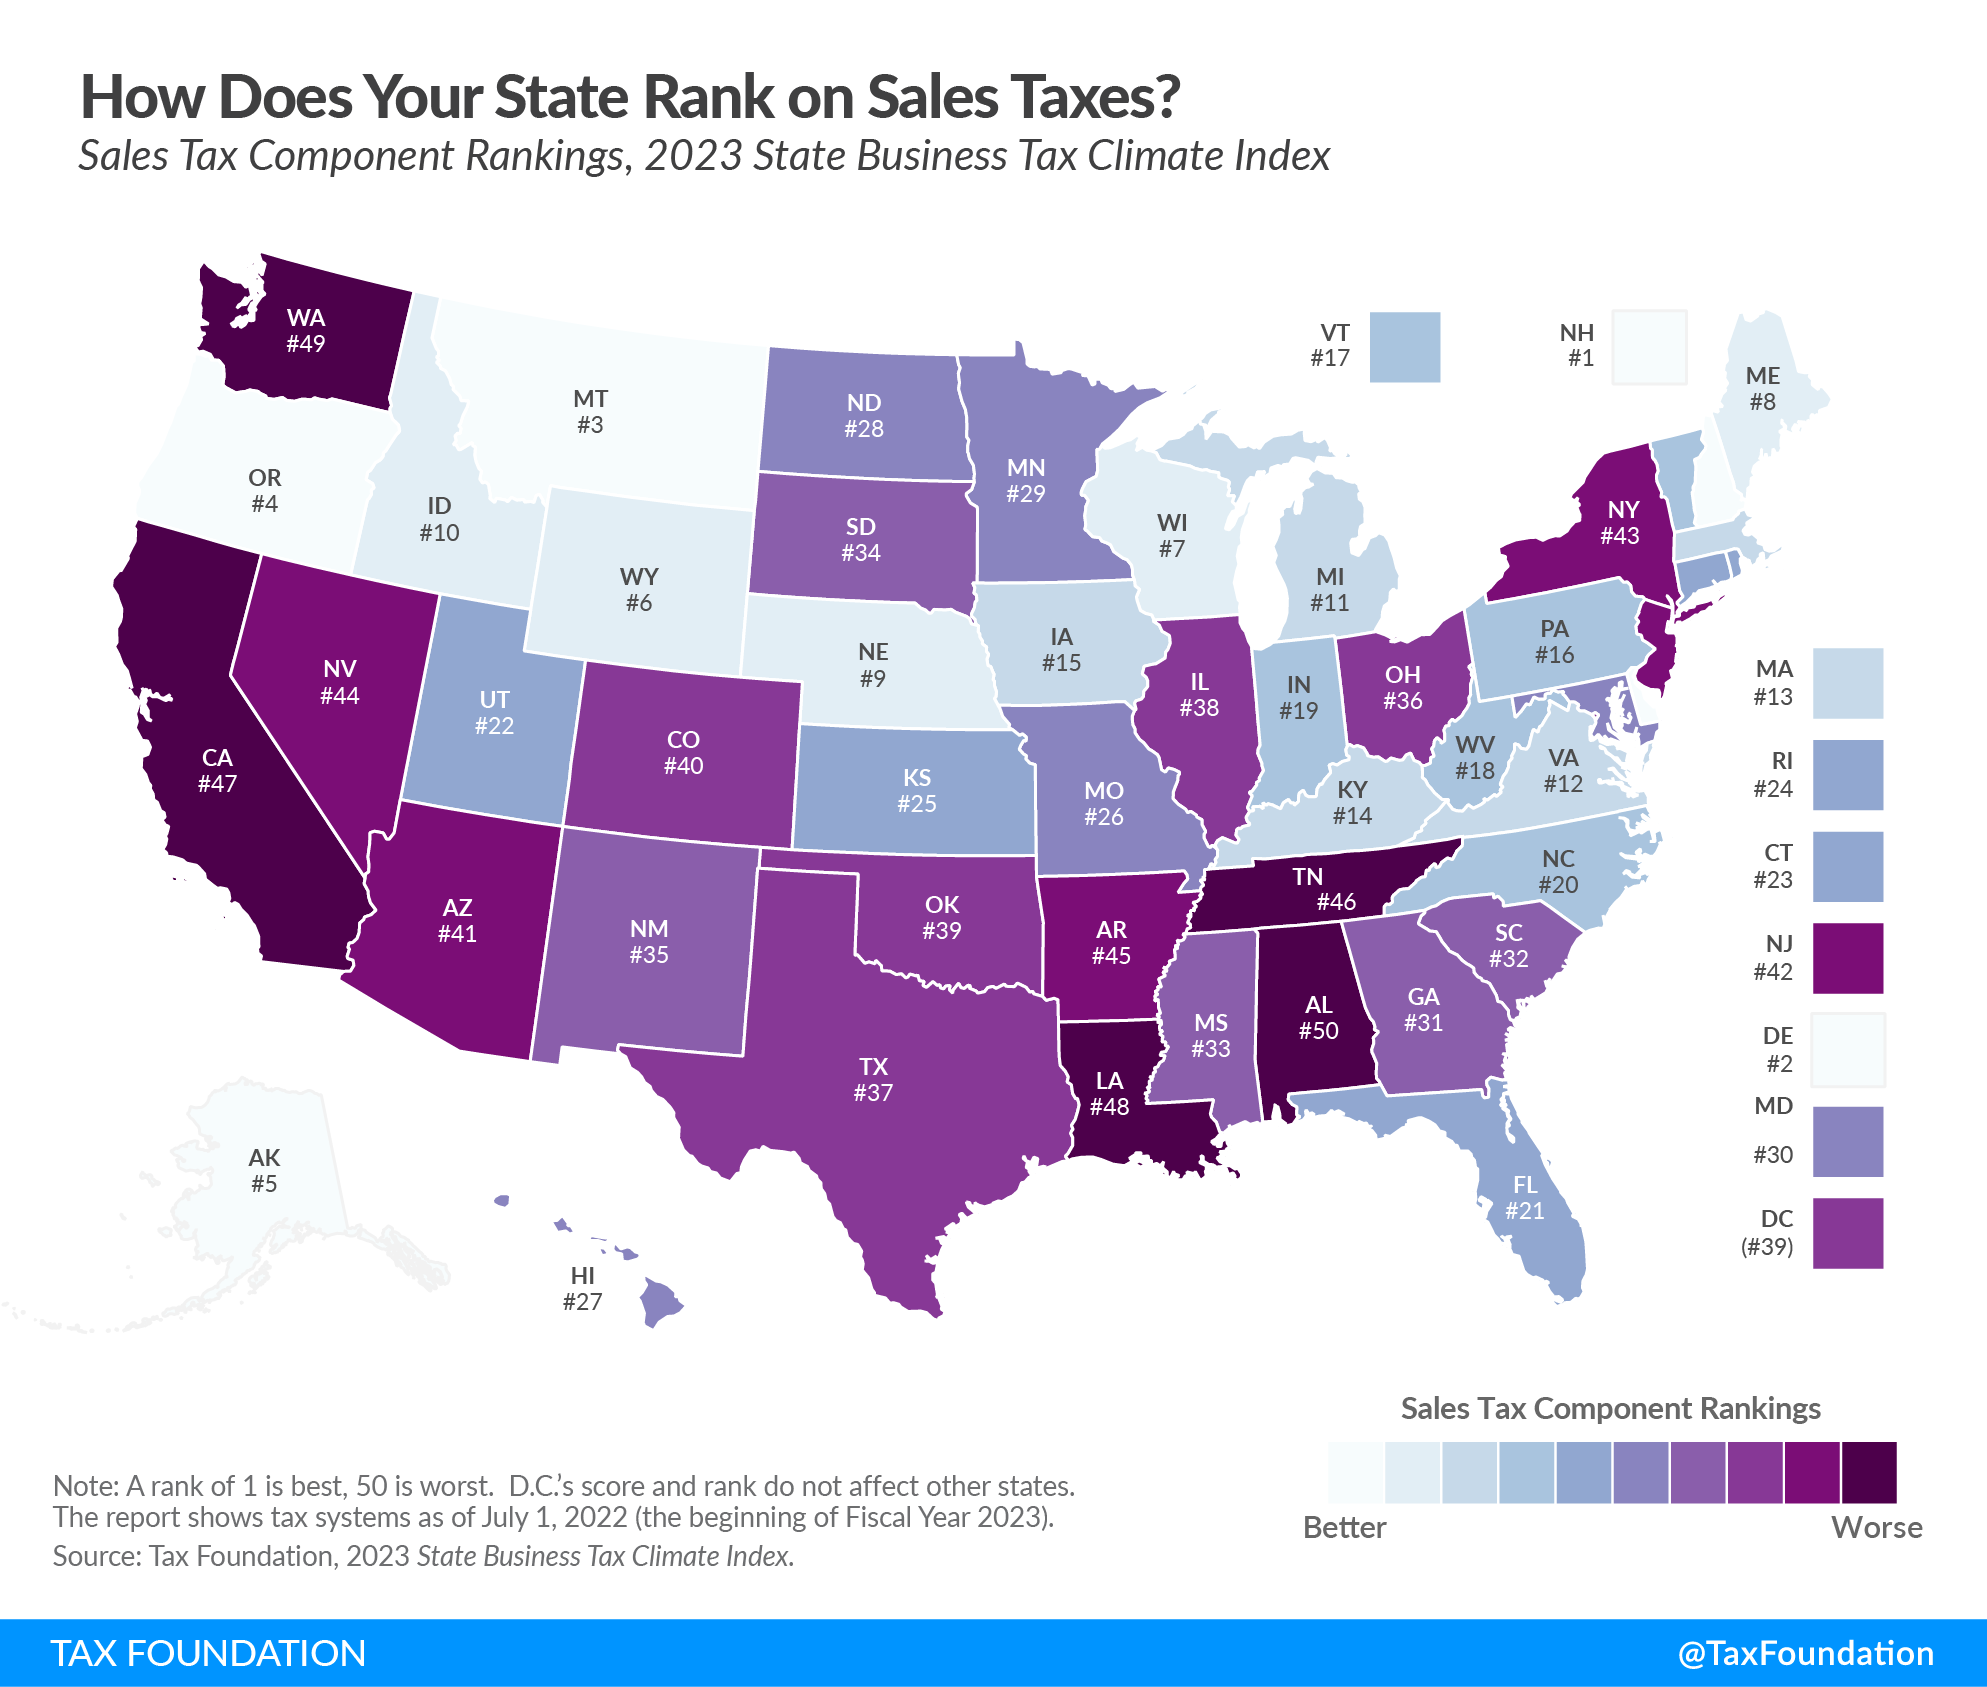
As shown on the map, the highest-scoring states on the sales tax component of the 2023 Index are those without a state sales tax: New Hampshire, Delaware, Montana, Oregon, and Alaska. (They do not receive perfect scores because each state does impose excise taxes with varying degrees of competitiveness, and Alaska permits local sales taxes.) The states with the next best scores—Wyoming, Wisconsin, Maine, Nebraska, Idaho, Michigan, and Virginia—have well-structured sales taxes and modest excise taxAn excise tax is a tax imposed on a specific good or activity. Excise taxes are commonly levied on cigarettes, alcoholic beverages, soda, gasoline, insurance premiums, amusement activities, and betting, and typically make up a relatively small and volatile portion of state and local and, to a lesser extent, federal tax collections. rates.
States that rank poorly on this component have high sales tax rates, high excise tax rates, and complicated sales tax administration. They also apply the sales tax to a variety of business inputs while exempting many final consumer purchases. The lowest-scoring states are Alabama, Washington, Louisiana, California, and Tennessee.
To learn more about your state’s score on the sales tax component, click here.
To see whether your state’s sales tax structure has become more or less competitive in recent years, check out the following table.
| Sales and Excise Tax Component of the State Business Tax Climate Index (2020–2023) | |||||
|---|---|---|---|---|---|
| State | 2020 Rank | 2021 Rank | 2022 Rank | 2023 Rank | Change from 2022 to 2023 |
| Alabama | 50 | 50 | 50 | 50 | 0 |
| Alaska | 5 | 5 | 5 | 5 | 0 |
| Arizona | 40 | 40 | 40 | 41 | -1 |
| Arkansas | 45 | 45 | 45 | 45 | 0 |
| California | 47 | 47 | 47 | 47 | 0 |
| Colorado | 37 | 36 | 38 | 40 | -2 |
| Connecticut | 26 | 25 | 23 | 23 | 0 |
| Delaware | 2 | 2 | 2 | 2 | 0 |
| Florida | 23 | 23 | 21 | 21 | 0 |
| Georgia | 30 | 29 | 29 | 31 | -2 |
| Hawaii | 29 | 28 | 28 | 27 | 1 |
| Idaho | 12 | 10 | 10 | 10 | 0 |
| Illinois | 34 | 39 | 39 | 38 | 1 |
| Indiana | 20 | 20 | 19 | 19 | 0 |
| Iowa | 15 | 15 | 15 | 15 | 0 |
| Kansas | 38 | 37 | 26 | 25 | 1 |
| Kentucky | 14 | 14 | 14 | 14 | 0 |
| Louisiana | 48 | 48 | 48 | 48 | 0 |
| Maine | 8 | 8 | 8 | 8 | 0 |
| Maryland | 19 | 18 | 27 | 30 | -3 |
| Massachusetts | 13 | 13 | 13 | 13 | 0 |
| Michigan | 11 | 11 | 11 | 11 | 0 |
| Minnesota | 28 | 27 | 31 | 29 | 2 |
| Mississippi | 33 | 32 | 33 | 33 | 0 |
| Missouri | 24 | 24 | 25 | 26 | -1 |
| Montana | 3 | 3 | 3 | 3 | 0 |
| Nebraska | 9 | 9 | 9 | 9 | 0 |
| Nevada | 44 | 44 | 44 | 44 | 0 |
| New Hampshire | 1 | 1 | 1 | 1 | 0 |
| New Jersey | 42 | 42 | 43 | 42 | 1 |
| New Mexico | 41 | 41 | 41 | 35 | 6 |
| New York | 43 | 43 | 42 | 43 | -1 |
| North Carolina | 21 | 21 | 20 | 20 | 0 |
| North Dakota | 27 | 30 | 30 | 28 | 2 |
| Ohio | 32 | 34 | 35 | 36 | -1 |
| Oklahoma | 39 | 38 | 37 | 39 | -2 |
| Oregon | 4 | 4 | 4 | 4 | 0 |
| Pennsylvania | 17 | 17 | 17 | 16 | 1 |
| Rhode Island | 25 | 26 | 24 | 24 | 0 |
| South Carolina | 31 | 31 | 32 | 32 | 0 |
| South Dakota | 35 | 33 | 34 | 34 | 0 |
| Tennessee | 46 | 46 | 46 | 46 | 0 |
| Texas | 36 | 35 | 36 | 37 | -1 |
| Utah | 22 | 22 | 22 | 22 | 0 |
| Vermont | 16 | 16 | 16 | 17 | -1 |
| Virginia | 10 | 12 | 12 | 12 | 0 |
| Washington | 49 | 49 | 49 | 49 | 0 |
| West Virginia | 18 | 19 | 18 | 18 | 0 |
| Wisconsin | 7 | 7 | 7 | 7 | 0 |
| Wyoming | 6 | 6 | 6 | 6 | 0 |
| District of Columbia | 36 | 34 | 37 | 39 | -2 |
|
Note: A rank of 1 is best, 50 is worst. All scores are for fiscal years. DC’s score and rank do not affect other states. Source: Tax Foundation. |
|||||