


European Tech Firms Have Low Levels of Capital Spending
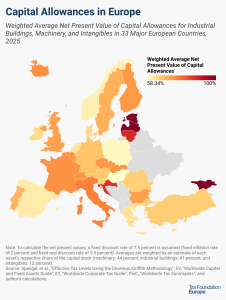
5 min readBy:In the context of the debate in the EU over digital taxation there has been little attention paid to the economic impact that digital firms have on the European economy and the incentives they face relative to the politics of the proposals. Over the last several decades companies in heavily digitalized sectors have experienced incredible growth in many countries around the world, but some analysis has highlighted that Europe has been left behind.
A recent blog points out that The Economist has found that just eight of the 200 largest digital companies in the world are European, and The Wall Street Journal analysis shows just 14 European tech companies have been valued at $1 billion or more. The United States has 97 such tech companies.
These two metrics show where Europe is falling short of its competitors for tech innovation, but what about investment by tech companies?
Stay informed on the tax policies impacting you.
Subscribe to our free newsletter to get the latest tax data, news and analysis.
SubscribeUsing data gathered by a professor of finance at the Stern School of Business at New York University, I find that tech sector companies in Europe spend less on capital investment when compared to the U.S., Japan, or emerging markets countries. Economic growth theory has long held that capital investment by firms is a key contributor to long-run economic growth, and investment in equipment by firms is a strong driver of growth in particular. If Europe’s tech sector is lagging in capital spending, then this will likely impact European growth for years to come.
For this analysis, I define industries in the tech sector to include Computer Services, Computers/Peripherals, Electronics (Consumer & Office), Information Services, Retail (Online), Software (Entertainment), Software (Internet), Software (System & Application), and Telecom (Wireless).
These sectors were selected after reviewing the industries covered by the database. One could argue that most industries have become so reliant on technology and digitalization that separating tech sectors from non-tech sectors is a fool’s errand. Because the data are downloadable, anyone who is interested could create a similar comparison to what follows using a different selection of sectors.
At a broad level, the 2017 data include 772 European firms from the nine tech sectors. In the U.S., there are 906 such firms, and the data has 535 tech firms in Japan. There are 1,429 tech firms in emerging markets countries which includes countries in Asia, Latin America, Eastern Europe, Middle East, and Africa.
|
Source: Author calculations Note: Europe includes the EU, UK, Switzerland, and Scandinavia, and Emerging Markets includes Asia, Latin America, Eastern Europe, Middle East, and Africa |
||||
| Industry Name | Number of Firms in Europe | Number of Firms in U.S. | Number of Firms in Japan | Number of Firms in Emerging Markets |
|---|---|---|---|---|
| Computer Services | 209 | 111 | 167 | 416 |
| Computers/Peripherals | 37 | 58 | 30 | 202 |
| Electronics (Consumer & Office) | 16 | 24 | 16 | 91 |
| Information Services | 31 | 61 | 18 | 63 |
| Retail (Online) | 57 | 61 | 37 | 36 |
| Software (Entertainment) | 33 | 13 | 18 | 58 |
| Software (Internet) | 153 | 305 | 116 | 168 |
| Software (System & Application) | 222 | 255 | 127 | 333 |
| Telecom (Wireless) | 14 | 18 | 6 | 62 |
| Total | 772 | 906 | 535 | 1429 |
For each industry, the database includes a number of variables, including capital expenditures. According to the author of the dataset, the capital expenditures variable is cumulated capital spending from the cash flow statements of firms and does not generally include acquisitions. Thus, it is a measure of how much firms are investing in machinery, equipment, buildings, or other assets that are part of their productive process.
The 772 tech firms in Europe invested $16.5 billion in 2017, while the 906 tech firms in the U.S. invested $85.4 billion in 2017 according to the data. Tech firms in Japan invested $32 billion in 2017, and firms based in emerging markets invested $110.5 billion in 2017.
|
Source: Author calculation Note: Europe includes the EU, UK, Switzerland, and Scandinavia, and Emerging Markets includes Asia, Latin America, Eastern Europe, Middle East, and Africa |
||||
| Industry Name | Europe | United States | Japan | Emerging Markets |
|---|---|---|---|---|
| Computer Services | $2,565.7 | $5,808.6 | $3,015.5 | $3,316.9 |
| Computers/Peripherals | $644.0 | $17,195.1 | $4,559.1 | $50,408.0 |
| Electronics (Consumer & Office) | $282.6 | $108.0 | $7,156.2 | $7,084.2 |
| Information Services | $549.4 | $5,065.6 | $54.5 | $500.8 |
| Retail (Online) | $870.6 | $11,829.5 | $322.5 | $349.8 |
| Software (Entertainment) | $131.9 | $334.0 | $390.7 | $388.4 |
| Software (Internet) | $521.1 | $20,295.3 | $490.7 | $2,549.9 |
| Software (System & Application) | $2,145.8 | $13,111.5 | $273.4 | $1,967.3 |
| Telecom (Wireless) | $8,741.2 | $11,684.7 | $16,558.7 | $43,983.2 |
| Total | $16,452.4 | $85,432.3 | $32,821.3 | $110,548.3 |
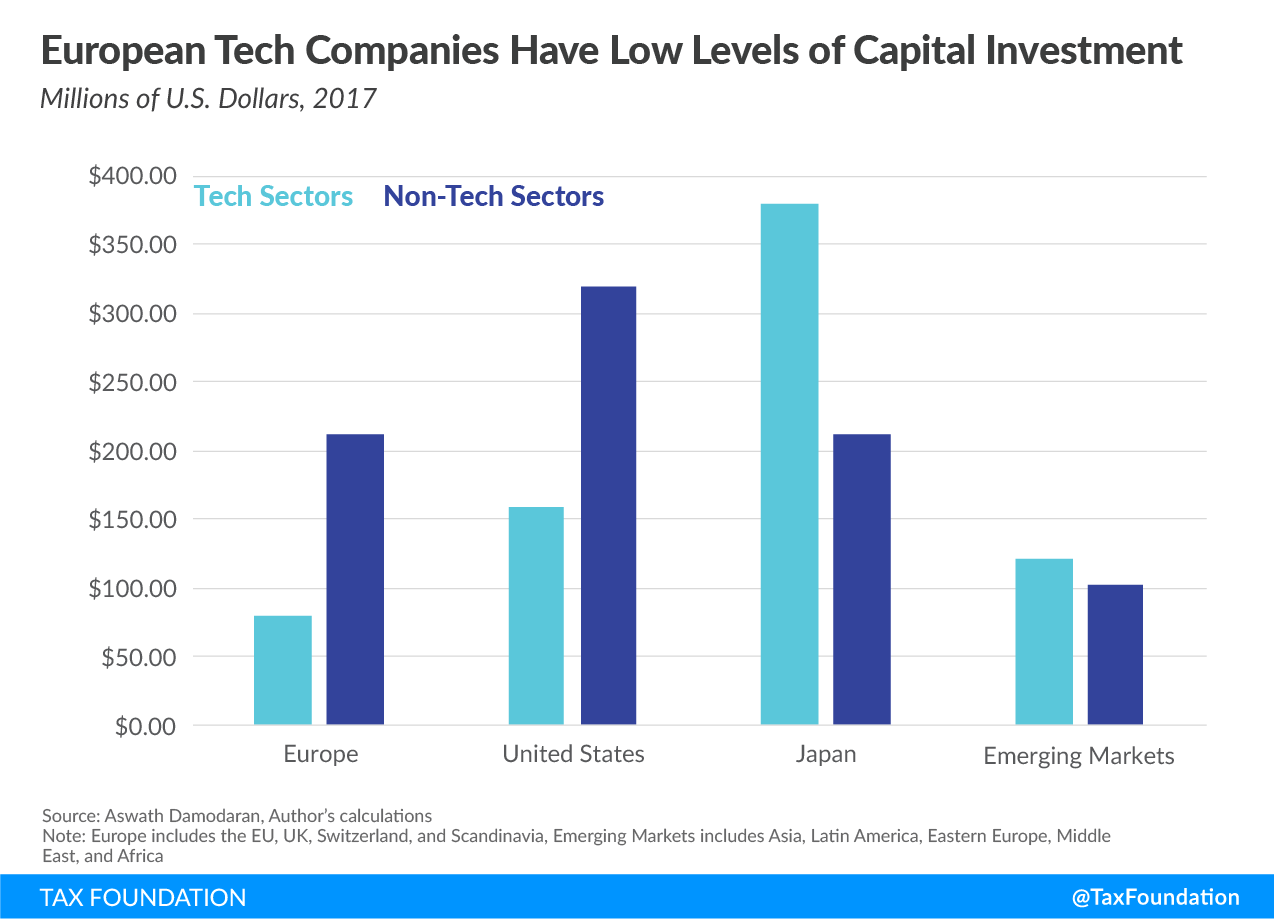
It is also worth comparing capital expenditure per firm. This provides a sense of how much the average firm is investing. Looking at an aggregation across all sectors, on average, European firms made $93.9 million worth of capital investments in 2017, compared to U.S. firms investing $115.1 million, Japanese firms investing $93.6 million, and firms in emerging markets countries investing $48.6 million.
taxfoundation.org/wp-content/uploads/2018/10/EU-digital-taxA tax is a mandatory payment or charge collected by local, state, and national governments from individuals or businesses to cover the costs of general government services, goods, and activities.-tech-firm-capital-expenditures-1.png” alt=”Capital Expenditure Per Firms Across Regions” width=”1274″ height=”919″ />
Splitting out capital spending per firm into tech sectors versus non-tech sectors shows that Europe lags the other regions. European tech firms invested $80.2 million on average in 2017, a bit more than half of what U.S. tech firm invested on average ($158.1 million). Japanese tech firms invested $212.2 million on average, and tech firms based in emerging markets invested $121.1 million on average.
Stay informed on the tax policies impacting you.
Subscribe to our free newsletter to get the latest tax data, news and analysis.
SubscribeAmong the nine individual industries that make up the tech sector definition, European companies have the lowest level of capital expenditure per firm in four [Computers/Peripherals, Software (Entertainment), Software (Internet), and Telecom (Wireless)] and the second-lowest level in two of them [Computer Services and Electronics (Consumer & Office)].
|
Source: Author calculations. Note: Europe includes the EU, UK, Switzerland, and Scandinavia, and Emerging Markets includes Asia, Latin America, Eastern Europe, Middle East, and Africa. |
||||
| Industry Name | Europe | United States | Japan | Emerging Markets |
|---|---|---|---|---|
| Computer Services | $12.30 | $52.30 | $18.10 | $8.00 |
| Computers/Peripherals | $17.40 | 296.50 | $152.00 | 249.50 |
| Electronics (Consumer & Office) | $17.70 | $4.50 | $447.30 | $77.80 |
| Information Services | $17.70 | $83.00 | $3.00 | $7.90 |
| Retail (Online) | $15.30 | 193.90 | $8.70 | $9.70 |
| Software (Entertainment) | $4.00 | $25.70 | $21.70 | $6.70 |
| Software (Internet) | $3.40 | $66.50 | $4.20 | $15.20 |
| Software (System & Application) | $9.70 | $51.40 | $2.20 | $5.90 |
| Telecom (Wireless) | $624.40 | 649.20 | $2,759.80 | 709.40 |
While these data do not present causal evidence, they do show that Europe is set apart from the other regions when it comes to capital spending by tech firms. These data also do not identify the location of where the investment is taking place, but most firms have a home-country bias when it comes to investing.
Innovative companies often pave the way for future growth, employment, and higher living standards. Countries and regions that host such companies can benefit greatly from the growth that they generate. However, policies that are designed to punish the success of innovative and growing firms can lead to long-term negative impacts.
European leaders can choose to continue to push policies that make the market environment for these tech firms more difficult, or they can choose to support and foster innovation with pro-growth and neutral policies that allow successful individuals and firms of all types to compete on a global scale.
Share this articleAbout the Author

Daniel Bunn is President and CEO of the Tax Foundation. Daniel has been with the organization since 2018 and, prior to becoming President, successfully built its Center for Global Tax Policy, expanding the Tax Foundation’s reach and impact around the world. Prior to joining the Tax Foundation, Daniel worked in the United States Senate at the Joint Economic Committee.