UPDATE: This post has attracted criticism from Paul Krugman here, and we have addressed his criticisms here.
President Obama this week renewed his pledge to raise taxes on high-income earners, based upon the premise that they do not pay their “fair share”. However, the latest data reveals that their share, whether fair or not, has actually gone up in recent years, while the share paid by everyone else has gone down.
The charts below show the latest data from the Congressional Budget Office (CBO) on income and federal taxes paid by households from 1979 to 2009. In Figure 1, we can see that average effective income taxA tax is a mandatory payment or charge collected by local, state, and national governments from individuals or businesses to cover the costs of general government services, goods, and activities. rates have declined considerably for almost everyone, except the top 1 percent of earners. The decline is most pronounced for the bottom quintile (bottom 20 percent) of households, whose average tax rateThe average tax rate is the total tax paid divided by taxable income. While marginal tax rates show the amount of tax paid on the next dollar earned, average tax rates show the overall share of income paid in taxes. went from zero in 1979 to a new record low of -9.3 percent in 2009. That means low-income households now receive more from the IRS in terms of refundable tax credits, such as the Earned Income Tax CreditA tax credit is a provision that reduces a taxpayer’s final tax bill, dollar-for-dollar. A tax credit differs from deductions and exemptions, which reduce taxable income rather than the taxpayer’s tax bill directly. , than they pay in taxes. This trend has accelerated since 2007, when their tax rate was -5.8 percent, mainly because of higher unemployment and underemployment.
The next quintile up the income scale shows the same basic pattern. Their average income tax rate went from 4 percent in 1979 to -2.6 percent in 2009, also a record low. That means the IRS is now a spending agency for the bottom 40 percent of households.
For all four of the bottom quintiles, i.e. the bottom 80 percent of households, the income tax rate has been dropping fairly steadily since the early 1980s. In contrast, the tax rate on the top 20 percent has held relatively steady at about 14 percent of income. The tax rate on the top 1 percent has also held fairly steady, but at a higher rate of about 21 percent. Since 2007, the tax rate on the top 1 percent has actually increased, from 19.4 percent to 21 percent, such that it is higher now than at any time since the Bush tax cuts. This is largely due to the collapse of the stock market, which reduced capital gains as a source of income.
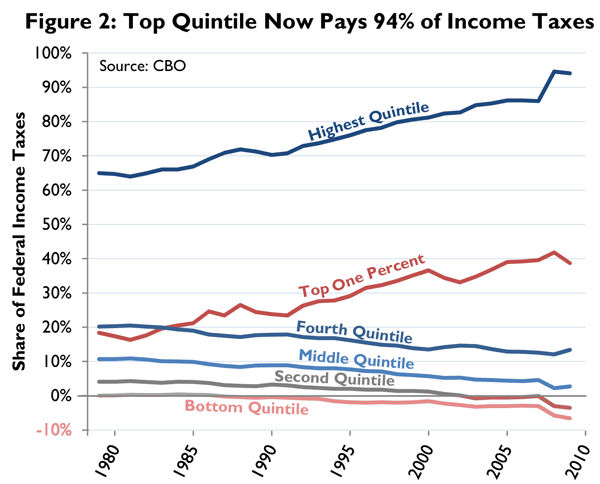
It follows that the share of income taxes paid by top earners has increased as well. As Figure 2 shows, in 2009 the share paid by the top 20 percent of households was 94.1 percent, just shy of the record high of 94.6 percent in 2008. This is up from 64.7 percent in 1979.
Likewise, the share of taxes paid by the top 1 percent has increased from 18.4 percent in 1979 to 38.7 percent in 2009. In contrast, the share of income taxes paid by the bottom four quintiles has decreased since 1979, particularly since 2007.
All of this points to increasing progressivity of the federal income tax code, which the CBO also measures. They find progressivity is at a record high, at least by one measure. By another measure it is near the record high.
Lastly, confirming the analysis I did earlier this year, the CBO finds that income inequality has decreased dramatically since 2007. As Figure 3 shows, the share of income earned by the top 1 percent is now back to where it was in the mid-1990s.


Follow William McBride on Twitter @EconoWill
Share this article