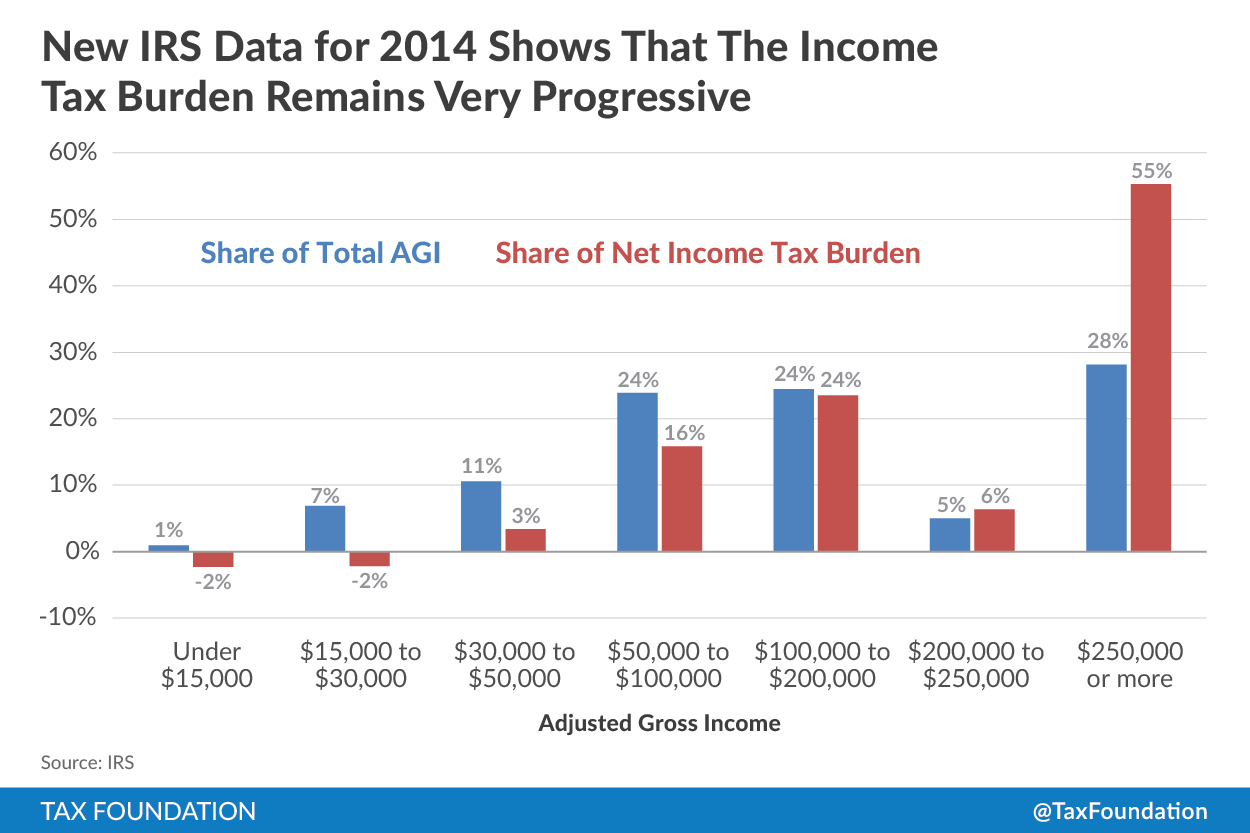
The IRS recently released preliminary data for Tax Year 2014. The data shows that the U.S. income taxA tax is a mandatory payment or charge collected by local, state, and national governments from individuals or businesses to cover the costs of general government services, goods, and activities. system remains very progressive, with high-income taxpayers paying a disproportionate share of the tax burden relative to their share of the nation’s income, while the majority of taxpayers pay a considerably smaller share relative to their share of total income.
Overall, nearly 149 million taxpayers filed a tax return in 2014. After adjusting for credits and deductions, 52 million filers (35 percent of the total) had no income tax liability, while the remaining 97 million filers paid nearly $1.3 trillion in income taxes.
As my colleague Scott Greenberg wrote last week, in 2014, America’s income tax bill grew by more than 10 percent over 2013, far surpassing the 6 percent growth in incomes. This is a clear indication that the tax code is rigged to ensure that tax revenues outpace the growth in the economy.
Much of the growth in income tax payments was generated by taxpayers at the top of the income scale. In 2013, taxpayers earning over $250,000 paid $603 billion in income taxes. By contrast, in 2014, these taxpayers paid $700 billion in income taxes, 16 percent more than 2013.
Moreover, their share of the income tax burden increased from 52 percent of total income taxes paid in 2013 (net of refundable tax credits) to 55 percent in 2014.
As the nearby chart shows, the wealthy’s tax burden is considerably larger than their share of the nation’s income. High-income taxpayers earned 28 percent of total adjusted gross (AGI) income in 2014 while paying 55 percent of the entire income tax burden. By contrast, the remaining 145 million taxpayers command 72 percent of the nation’s income, but paid a combined total of 45 percent of all income taxes.
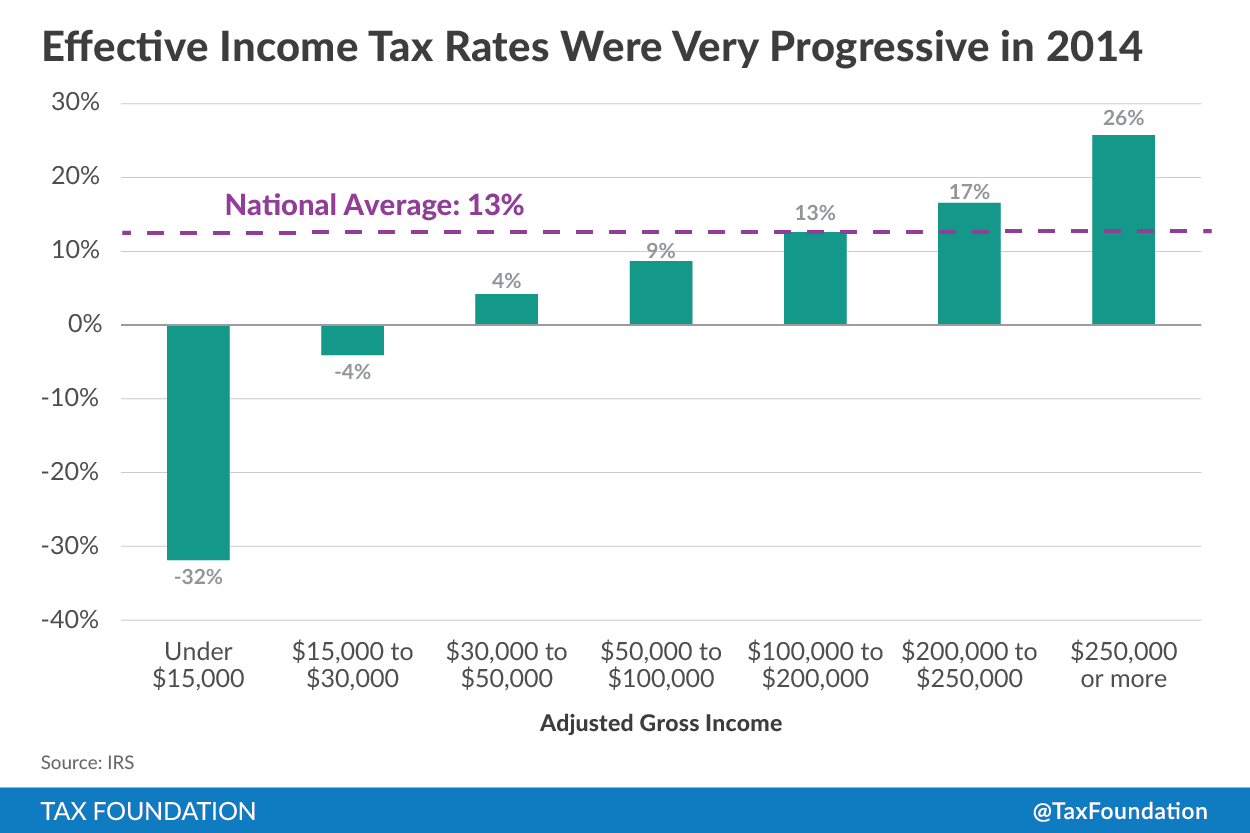
Another way of looking at the progressivity of the income tax is to compare effective income tax rates for taxpayers at different income levels. Effective tax rates measure how much of a taxpayer’s income is paid in taxes after accounting for all of the credits and deductions they may benefit from. The national average for all taxpayers is 13 percent, but the story is far more complicated.
The next chart shows that because of the very generous refundable tax credits aimed at low-income taxpayers, families earning under about $30,000 have a negative effective tax rate. What this means is that these refundable tax credits work to either supplement their income or offset their payroll taxes.
Many of these tax credit programs, such as the child tax creditA tax credit is a provision that reduces a taxpayer’s final tax bill, dollar-for-dollar. A tax credit differs from deductions and exemptions, which reduce taxable income rather than the taxpayer’s tax bill directly. , also benefit middle-income taxpayers but typically don’t erase their tax liability. However, as is evident in the chart, taxpayers in the $30,000 to $100,000 range have effective tax rates in the single digits.
Taxpayers in the $100,000 to $200,000 range tend to have an effective tax rate at the national average of 13 percent. Meanwhile, taxpayers earning more than $250,000 have an effective tax rate more than twice the national average, or 26 percent.
So while many politicians may argue that the wealthy don’t pay their fair share of income taxes, the data simply does not support that opinion.
Share this article
