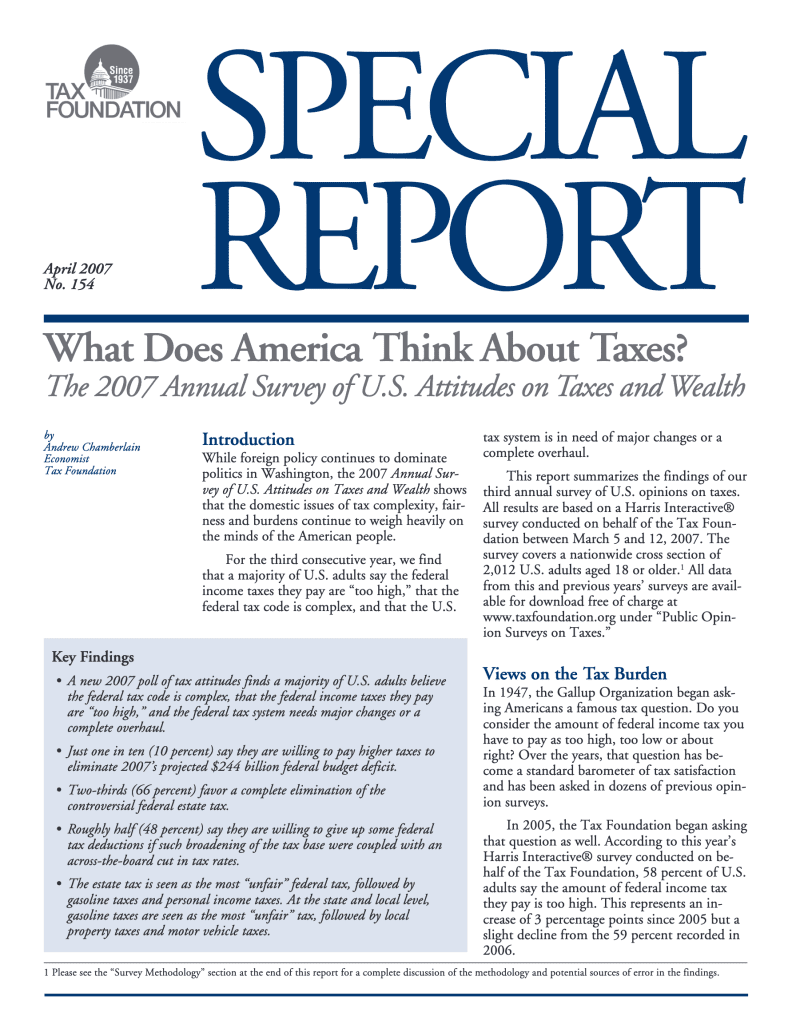
Just five days from the April 17th taxA tax is a mandatory payment or charge collected by local, state, and national governments from individuals or businesses to cover the costs of general government services, goods, and activities. deadline, we’ve released our third annual survey of U.S. opinions about taxes. You can read the full report here, or just browse the topline survey data here.
As you finish filling out your own tax returns, here are a couple of my favorite questions from the survey that explore the value we receive from government services in exchange for our annual tax burdens. Enjoy:
| 2007 | 2008 | 2009 | |
|---|---|---|---|
| Unweighted Base | 2,012 | 2,017 | 2,013 |
| 100% | * | – | – |
| 90% – 99% | * | * | – |
| 80% – 89% | * | * | – |
| 70% – 79% | * | * | – |
| 60% – 69% | * | * | – |
| 50% – 59% | 2% | 1% | 2% |
| 40% – 49% | 1% | 1% | 3% |
| 30% – 39% | 6% | 6% | 7% |
| 20% – 29% | 20% | 22% | 23% |
| 10% – 19% | 47% | 43% | 41% |
| 1% – 9% | 22% | 24% | 20% |
| 0% | 2% | 1% | 3% |
| MEAN | 14.7 | 15 | 16 |
| Source: Tax Foundation | |||
| Total | |
|---|---|
| Unweighted Base | 2,012 |
| $0 – 1000 | 43% |
| $1001 – 10000 | 46% |
| $10001 – 50000 | 9% |
| $51000 – 99999 | 1% |
| $100000+ | 1% |
| MEAN | $7243.80 |
| Source: Tax Foundation | |
| Total | |
|---|---|
| Unweighted Base | 2,012 |
| Keep taxes and services about where they are | 41% |
| Decrease services and lower taxes | 32% |
| Increase services and raise taxes | 8% |
| Not sure | 20% |
| Source: Tax Foundation | |
Read the full 12-page summary of the survey here.
Share this article