In recent weeks we have released estimates of the economic effects of the taxA tax is a mandatory payment or charge collected by local, state, and national governments from individuals or businesses to cover the costs of general government services, goods, and activities. plans proposed by several candidates for the Presidency. Some of these plans appear to be capable of generating very strong growth, enough to lift GDP by 10 percent or more over the next decade above the growth that would occur under current tax policy. Reaching that higher level of output would require the economy to grow at about 3.3 percent a year instead of the rather feeble 2.3 percent a year forecast by the Congressional Budget Office.
Some commentators have questioned whether the GDP could actually grow an additional 10 percent in 10 years, above current growth rates. They point to a slowdown in population growth, sluggish investment and productivity gains, and other issues as reasons not to expect robust growth to be possible. They claim we are within a few points of reaching full employment output, and there is no room to grow beyond that. They cannot imagine policies that would remedy the problem. They have thrown in the towel on growth.
We view these obstacles to additional growth as partially policy-driven and correctible. We do not hold the government responsible for the current baby bust (and we doubt that such incentives as child credits would reverse it, as indeed they have failed to do in Europe). However, we do believe that bad tax and regulatory policies are responsible in large part for the slump in capital formation and productivity gains, and for a startling decline in the labor force participation rate, the rise in discouraged workers, and the increase in involuntary part time employment. We believe that economic capacity is far higher under the right policy regime than the economy’s detractors give it credit for.
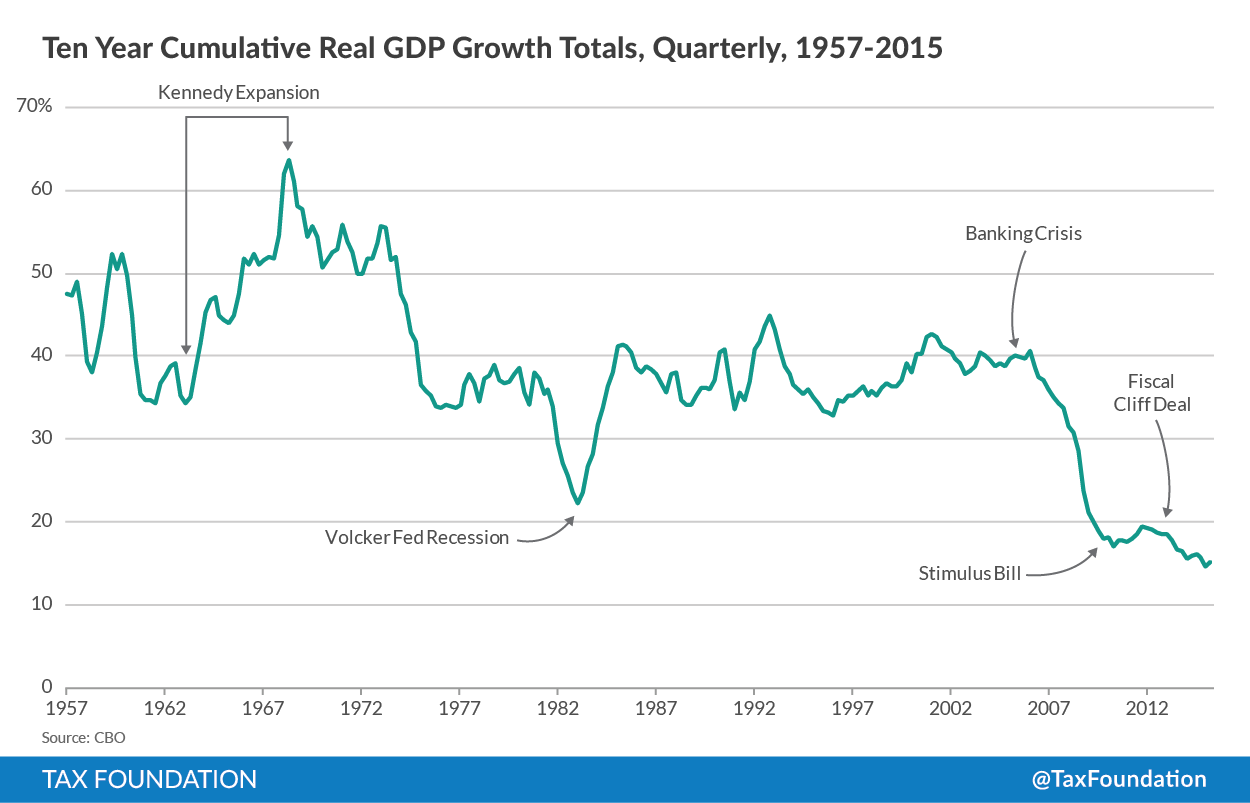
History is a good guide to what is possible. Below is a chart of the cumulative percentage increase in real (inflationInflation is when the general price of goods and services increases across the economy, reducing the purchasing power of a currency and the value of certain assets. The same paycheck covers less goods, services, and bills. It is sometimes referred to as a “hidden tax,” as it leaves taxpayers less well-off due to higher costs and “bracket creep,” while increasing the government’s spending power. adjusted) GDP over 10-year periods, by quarter. The first period shown is the total cumulative 10-year growth beginning with the first quarter of 1947 and ending with the first quarter of 1957. The last period shown is the 10 years from the second quarter of 2005 to the second quarter of 2015. There are 234 periods graphed.
From the first quarter of 1947 to the first quarter of 1957, real GDP rose 48 percent (a bit less than 4.8 percent a year, compounded). Moving forward quarter by quarter, the best 10-year growth was the 64 percent gain for the 10 years ending in the second quarter of 1968, during the Kennedy tax cut expansion. The period ending in the third quarter of 2008 showed 29 percent growth, before the figures plunged in response to the great recessionA recession is a significant and sustained decline in the economy. Typically, a recession lasts longer than six months, but recovery from a recession can take a few years. .
Growth has lagged since then. Over the last 10 years, real GDP has grown a total of 15 percent. That is only three-eighths as much as a normal decade pre-2009.
Can we not do at least 10 percentage points better in the next decade than this recent 15 percent total? We can start by asking, “How often has the increase in real GDP over a 10-year period exceeded 25 percent?” In fact, it has usually done so, except since the 2007-2009 banking crisis and the associated great recession. Of the 207 decade-long periods ending in the third quarter of 2008, only three fell below a 25 percent increase. Those were the three periods ending 1982 IV through 1983 II, with 22 percent to 24 percent growth. That short span was depressed by the V-shaped Volcker Federal Reserve recession, which squeezed the disruptive 1970s inflation out of the economy, and paved the way for strong non-inflationary growth.
But the CBO is forecasting an almost 26 percent gain in real GDP over the 10 ten years. That is the baseline against which we forecast the additional GDP growth from the tax plans. How often has the economy grown 10 points better than that, by at least 36 in a 10 year period? In fact, 154 of the 207 10-year periods though the third quarter of 2008 III achieved 36 percent GDP growth. Gains were at least 36 percent almost three-quarters of the time. And they were at least 34 percent for 191 periods, or about 92 percent of the time. If one were willing to wait 12 years for a 10-point GDP gain relative to the current CBO projection, it would have been a near certainty before the great recession.
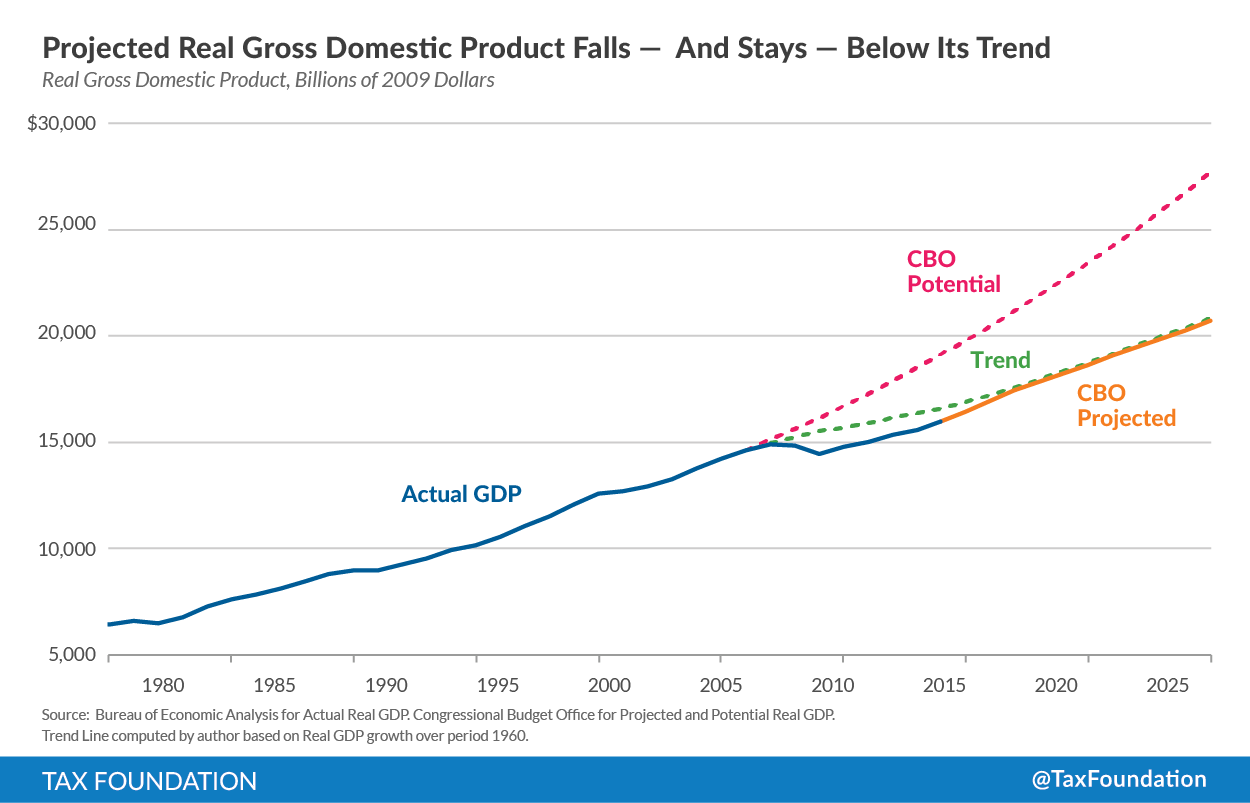
But what of the claim that we are too close to full employment to reach such levels? Is there room for the economy to grow that much? The following graph shows how the CBO forecast of economic capacity has been tilted down to meet the poor growth forecast, suggesting that we shall never recover the growth lost in the great recession relative to the long-running pre-recession trend. The current level of GDP is about 17 percent below the level it would have reached at its trend rate of growth from 1960 to 2006 (about 3.35 percent a year). Potential and actual growth lost to the great recession is recoverable under the right set of policies.
The greatest damage to potential output has been lagging capital formation. Curing that could be accomplished by making 100 percent expensing for equipment permanent, reducing the corporate tax rate to 25 percent, repeal of the investment income and labor income surtaxes imposed by the ACA, and rolling back the income and capital gains taxA capital gains tax is levied on the profit made from selling an asset and is often in addition to corporate income taxes, frequently resulting in double taxation. These taxes create a bias against saving, leading to a lower level of national income by encouraging present consumption over investment.
increases in the fiscal cliff budget deal. These policies would boost capital formation and add nearly six percent to actual and potential GDP. The great recession has discouraged workers from entering the labor force. The labor force participation rate was 67.3 percent in January, 2000, before the dot.com recession. It fell to just over 64 percent in mid-2008, and has dropped to 62.4 percent in September of 2015. Labor generates almost two-thirds of GDP. Returning the participation rate to the 2000 level would restore another four to five percent in lost capacity. Reform that accomplishes this only requires the imagination and the political will.