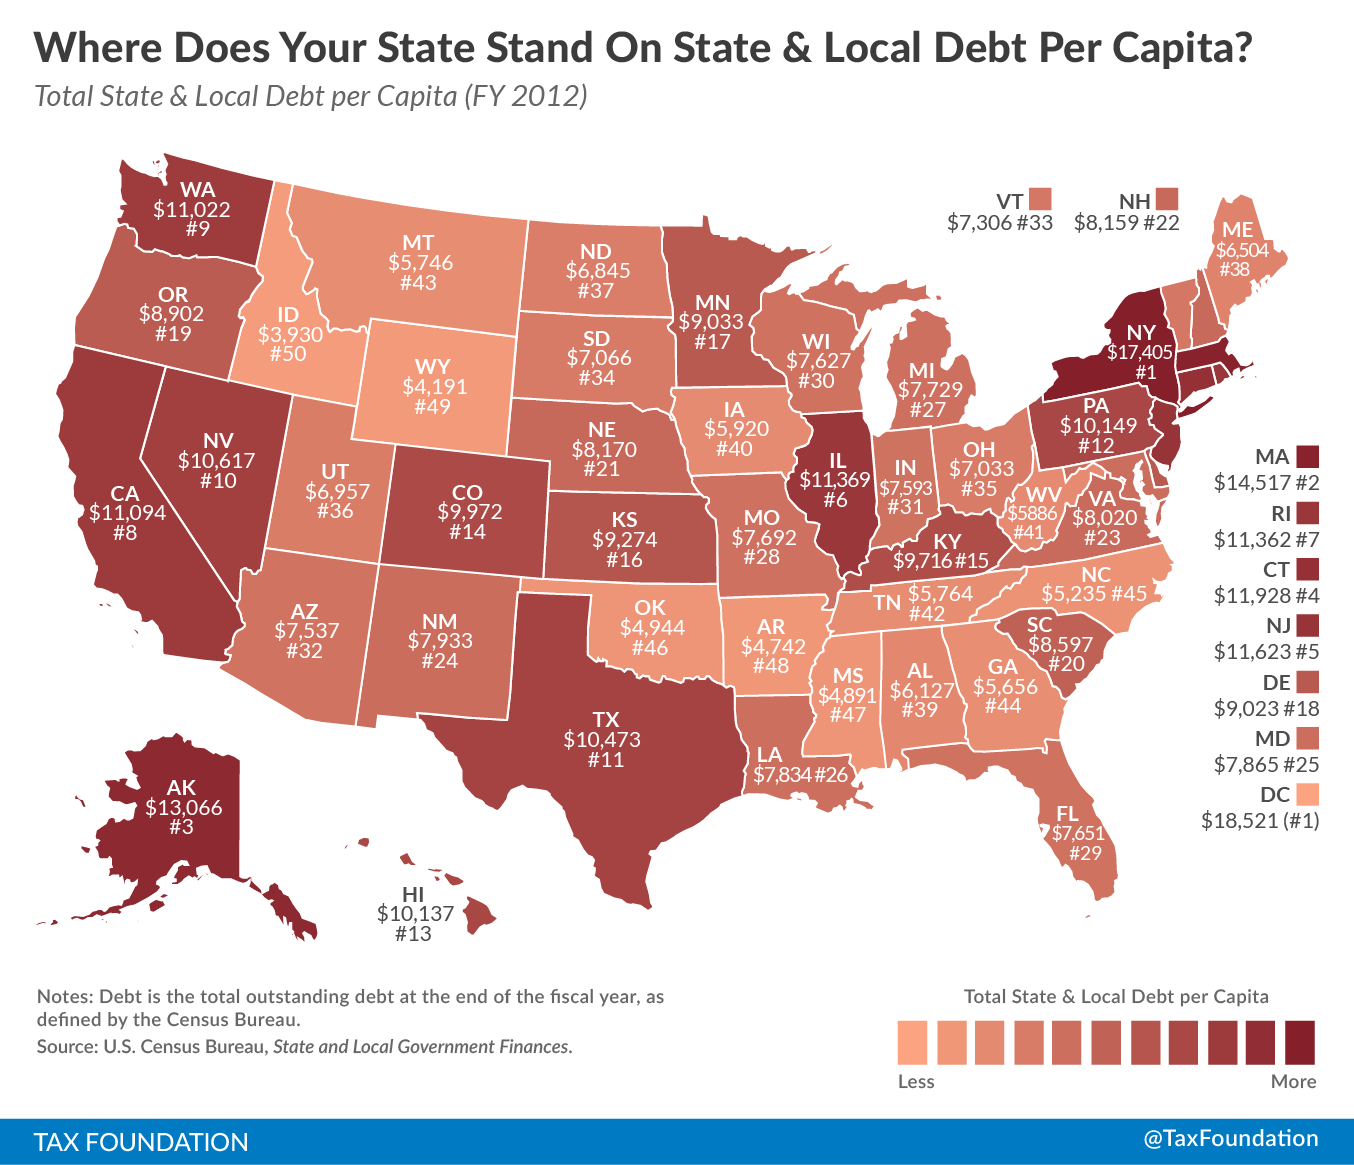
Today’s map looks at state and local government debt. State and local debt can be broken out into short-term and long-term debt. Short-term debt, typically in the form of “revenue anticipation notes,” is typically issued to align collections with expenditures over the budget cycle, since expenditures tend to be fairly evenly distributed throughout the year, whereas most tax collections are concentrated around a few major deadlines. Relying on short-term debt to fill shortfalls rather than to smooth collections can be perilous, and is frequently restricted by balanced budget requirements.
Long-term debt, by contrast, is typically issued to cover the costs of capital projects, particularly infrastructure improvements. In these cases, debt allows governments to amortize costs over the life of a project—roads, bridges, government buildings, etc.—rather than incurring it all at once. Additionally, some long-term debt takes the form of what the Census Bureau terms “public debt for private purposes,” in which some private party or private sector transaction (anything from hospitals, stadiums, or commercial developments to government-secured mortgages or student loans) is secured by the government, although the private party still has the obligation to make the payments. In FY 2012, only 1.5 percent of all state and local government debt was short-term, though over 20 percent of long-term debt took the form of public debt for private purposes.
Just as with private finances, there is “good debt” and “bad debt.” Governments which turn to debt to fund recurring expenditures are similarly situated to individuals who go into debt in paying their monthly bills. Public debt for private purposes is a little like co-signing a loan: it’s not taxpayer-supported debt, and while it may count toward caps, ideally the government won’t be the one making the payments—but there’s always that risk. Conversely, capital projects are more analogous to a home loan. An individual project may or may not be prudent, the costs may or may not be reasonable, and the capacity to undertake additional debt may or may not be there, but assuming rational expenditures, relying on long-term debt as a means of covering the cost can be entirely reasonable.
It is important to note that the figures here are for bonded debt, and do not include other outstanding obligations—including pensions—which add substantially to governments’ future liabilities and are often considered in broader definitions of governmental debt.
Check out the map below to see how your state measures up.

Click on map to enlarge. (See our reposting policy here.)
States with the highest amount of state and local debt per capita in the 2012 fiscal year (the most recent data available from the Census Bureau) were New York ($17,405 per person), Massachusetts ($14,517 per person), Alaska ($13,066 per person), Connecticut ($11, 928 per person), and New Jersey ($11,623 per person).
On the other end of the spectrum, states with the lowest state and local debt per capita were Idaho ($3,930 per person), Wyoming ($4,191 per person), Arkansas ($4,742 per person), Mississippi ($4,891 per person), and Oklahoma ($4,944 per person).
To check out the raw data and see the short-term vs. long-term breakdown for your state, visit this website over at the Census Bureau.
Share this article