Download FISCAL FACT No. 412: Official Statistics on Inequality, the Top 1%, and Redistribution
President Obama will reportedly focus much of his State of the Union speech on addressing inequality and mobility in America. Undoubtedly, these issues will generate a considerable amount of rhetoric by pundits and politicians on both sides of the aisle in the days ahead. Much of this rhetoric will not be supported by data or facts.
In order to bolster this discussion with data, we’ve summarized some of the recent work done on inequality and mobility by the Congressional Budget Office and the IRS. Links are provided to the original source material.
Highlights of these reports include:
-
Inequality: CBO data shows that inequality today is slightly higher than the average of the past thirty years, but less that it was during the last two years of the Clinton administration.
-
Progressivity: According to the CBO’s progressivity index, the federal taxA tax is a mandatory payment or charge collected by local, state, and national governments from individuals or businesses to cover the costs of general government services, goods, and activities. code is as progressive today as it has been at any time during the past thirty years.
-
The Top 1%: The Top 1% continues to pay a larger share of the federal income tax burden than the bottom 90 percent combined.
-
Redistribution: Using 2006 data, CBO found that tax and spending policies combined to redistribute $1.2 trillion in income from the top 40 percent of non-elderly households to the bottom 60 percent of non-elderly households.
-
Mobility: IRS panel data that tracked the same group of taxpayers between 1999 and 2007 showed that Americans can move from one economic group to another fairly quickly.
Inequality
A new CBO report measured the level of inequality in America between 1979 to 2010 as measured by the Gini Index. This index measures the relative distribution of income between groups of households on a scale of 0 to 1, with zero being perfect equality and 1 being all income is concentrated entirely at the top.
In 2010, the Gini Index for pre-tax income stood at 0.474, just slighly above the thirty year average of 0.451. The pattern for post-tax income is the same. The data shows that inequality today is less that it was during the last two years of the Clinton administration.

While inequality has gone through peaks and valleys over the past three decades, it has tended to stay within a fairly narrow range—between 0.400 and 0.500—and has largely tracked the business cycle. The peaks have typically been during times when the economy was booming or in a bubble (such as in 1986, 2000, 2007), while the valleys have come during weak economic times (such as 1979-1982, 1991, 2001-2002, and 2008-2009).
[Source: CBO, The Distribution of Household Income and Federal Taxes, 2010, supplemental data, table 9]
Progressivity of the Tax Code
According to the CBO’s progressivity index, the federal tax code is as progressive today as it has been at any time during the past thirty years. The spike in progressivity after 2007 is largely the result of the expansion of various credits—such as the child credit, the Earned Income Tax CreditA tax credit is a provision that reduces a taxpayer’s final tax bill, dollar-for-dollar. A tax credit differs from deductions and exemptions, which reduce taxable income, rather than the taxpayer’s tax bill directly. , and the temporary Making Work Pay tax credit. Many of these credits were made refundable so that taxpayers received a check back from the IRS even if they have no tax liability. The data for 2010, of course, does not yet reflect the increase in top income tax rates that was enacted in January 2013.
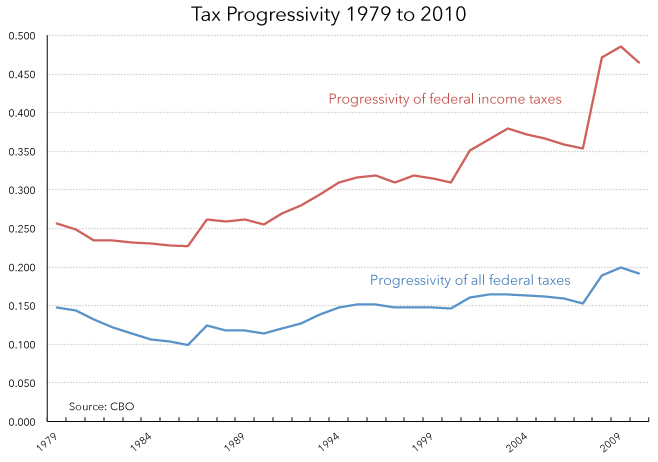
Interestingly, while the Bush tax cuts are often cited as a cause of today’s rise in inequality, the progressivity of the income tax system remained far higher after the enactment of those tax cuts than at any time since 1979.
[Source: CBO, The Distribution of Household Income and Federal Taxes, 2010, supplemental data, table 9]
The Top 1%
Recently released IRS data for 2011 shows that the Top 1% of taxpayers earned 18.7 percent of the nation’s adjusted gross incomeFor individuals, gross income is the total pre-tax earnings from wages, tips, investments, interest, and other forms of income and is also referred to as “gross pay.” For businesses, gross income is total revenue minus cost of goods sold and is also known as “gross profit” or “gross margin.” (AGI) and paid 35.1 percent of all income taxes. Both of these figures are slightly below 2010 levels. However, the Top 1% paid an average tax rateThe average tax rate is the total tax paid divided by taxable income. While marginal tax rates show the amount of tax paid on the next dollar earned, average tax rates show the overall share of income paid in taxes. of 23.5 percent in 2011, a slightly higher percentage than in 2010.

The Top 1% is comprised of roughly 1.36 million taxpayers. As the nearby chart shows, the Top 1% continues to pay a larger share of the federal income tax burden than the bottom 90 percent combined, which is comprised of 122 million taxpayers.
Sources:
Tax Foundation, Summary of Latest Federal Income Tax Data, https://files.taxfoundation.org/docs/Summary%20of%202011%20Tax%20Data%20FF.xls
Internal Revenue Service, SOI Tax Stats–Individual Income TaxAn individual income tax (or personal income tax) is levied on the wages, salaries, investments, or other forms of income an individual or household earns. The U.S. imposes a progressive income tax where rates increase with income. The Federal Income Tax was established in 1913 with the ratification of the 16th Amendment. Though barely 100 years old, individual income taxes are the largest source of tax revenue in the U.S. Rates and Tax Shares, http://www.irs.gov/uac/SOI-Tax-Stats-Individual-Income-Tax-Rates-and-Tax-Shares.
Addressing Inequality: Federal Taxes Paid and Spending Received
A recent CBO study found that government tax and spending policies are doing a lot to address inequality by redistributing income from high-income households to low- and middle-income households. Indeed, using 2006 data, CBO found that tax and spending policies combined to redistribute $1.2 trillion in income from the top 40 percent of non-elderly households to the bottom 60 percent of non-elderly households. [A similar Tax Foundation report estimated that in 2012, the total amount of federal redistribution from the top 40 percent of families was $1.5 trillion].
Naturally, low-income households receive considerably more in federal spending than they pay in federal taxes of all kinds. CBO estimated that in 2006, the typical low-income household with a median income of $9,000 received $9.62 in federal spending for every $1 it paid in taxes. A typical middle-income household, with a median income of $55,000, received $1.19 in spending for every $1 it paid in total federal taxes. Meanwhile, a typical high-income household, with a median income of $150,000 received 0.17 cents in spending for every $1 it paid in federal taxes.
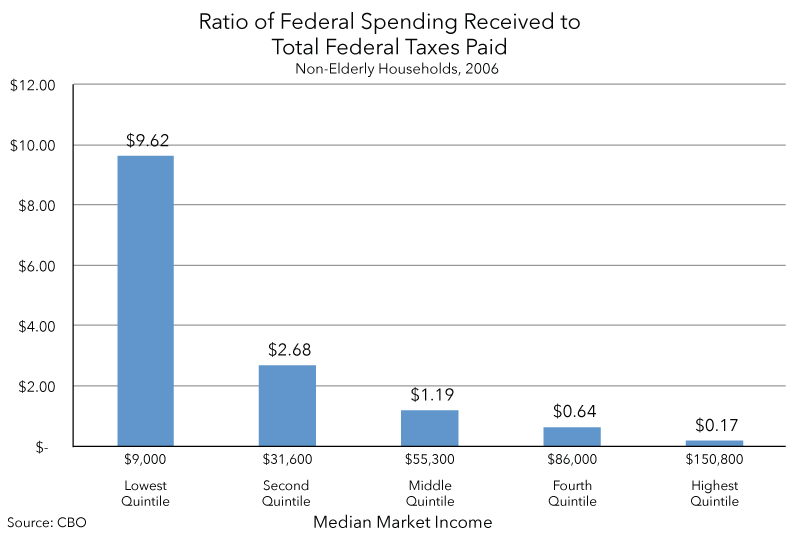
Source: CBO, Distribution of Federal Spending and Taxes in 2006, see supplemental data, Exhibit 23.
See also: Gerald Prante and Scott A. Hodge, “The Distribution of Tax and Spending Policies in the United States,” Tax Foundation Special Report no. 211, November 8, 2013.
Mobility
While America certainly has its share of people in chronic poverty and those with vast wealth, we are an economically mobile society. There are no class or cast systems that might prevent anyone with initiative from bettering their station in life. IRS data tracking the same group of taxpayers between 1999 and 2007 showed that Americans can move from one economic group to another fairly quickly. For example, nearly 60% of taxpayers who began in the lowest income group in 1999, moved to a higher income group by 2007. Conversely, roughly 40% of taxpayers who started out in the highest income group moved to lower income groups within eight years.
|
Table 1: More than 50 Percent of Taxpayers Moved Out of the Bottom Quintile Between 1999 and 2007 |
||||||
|
1999 Income Quintile/Percentile |
2007 Income Quintile/Percentile |
|||||
|
Lowest |
Second |
Third |
Fourth |
Fifth |
Total |
|
|
Lowest |
42.5% |
25.1% |
16.3% |
10.4% |
5.7% |
100.0% |
|
Second |
32.2% |
34.7% |
17.3% |
10.8% |
5.0% |
100.0% |
|
Third |
14.4% |
26.0% |
32.8% |
17.8% |
8.9% |
100.0% |
|
Fourth |
7.7% |
10.7% |
25.7% |
37.7% |
18.3% |
100.0% |
|
Fifth |
3.1% |
3.8% |
7.5% |
23.3% |
62.3% |
100.0% |
|
Tax Foundation calculations based on IRS data from the 1999-2007 SOI Individual Tax Panel. |
Source: Robert Carroll, Income Mobility and the Persistence of Millionaires, 1999 to 2007 , Tax Foundation Special Report no. 180, June 21, 2010
For more information on tax burdens, inequality, and tax reform, see: Putting a Face on America’s Tax Returns: A Chart Book Second Edition, Tax Foundation, October 2013.
Share