If it feels like you’re paying more in property taxes, it’s probably because you are. (And it may be in your mind, as taxA tax is a mandatory payment or charge collected by local, state, and national governments from individuals or businesses to cover the costs of general government services, goods, and activities. payments are due in a number of jurisdictions.) While we can’t help you pay your property taxes, we can help you see how your property taxes compare to other counties and states.
While other tax revenue sources for state and local governments have been sluggish in the economic downturn, property taxes continue to be strong revenue collectors. This is driven in part by local governments’ ability to increase rates even as assessed values drop. Below is a chart of the average annual change in state and local tax revenue since 2007 (from the U.S. Census Bureau):
Average Annual Change in State and Local Tax Revenues by Type of Tax, 2007-2011
| All State and Local Taxes | Individual Income Tax | Corporate Income Tax | Property Tax | Sales/Gross Receipts Tax | Gasoline Tax | Cigarette Tax | Alcohol Taxes | Car Taxes & Drivers License Fees |
| +1.7% | +0.1% | -4.7% | +5.0% | -0.1% | +1.5% | +3.5% | +2.8% | +2.7% |
Source: U.S. Census Bureau Quarterly Summary of State and Local Government Tax Revenue
Also see:
- Our latest report on property taxes from earlier this year, identifying the jurisdictions with the highest and lowest property taxes
- Our lookup tool, where you can compare property taxes in most U.S. counties
- The latest property tax data.
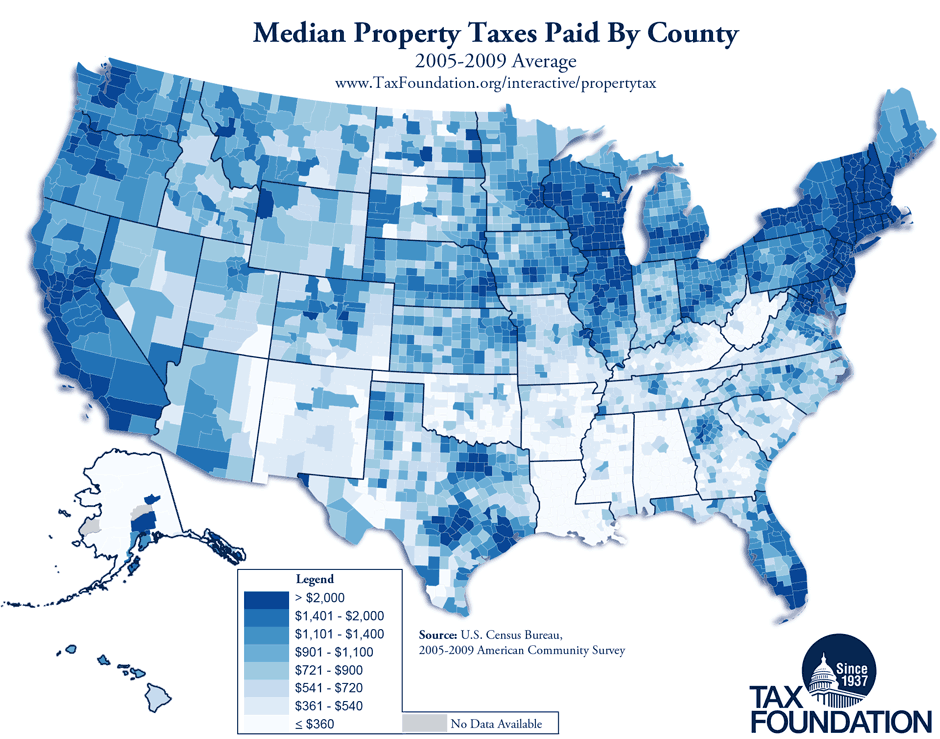
This map shows the median property taxes paid for each county in the U.S.: