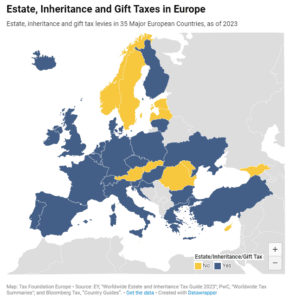
A new report from the Tax Foundation discusses the effect on income redistribution from the recently passed health care reform bill. Here are the summary results: Table 1 Summary of Income Redistribution Before and After Health Care Reform Fiscal Year 2016 Market Income Percentile Average Income Redistribution (OMB Baseline) Average Income Redistribution (Post-HCR) Change in Income Redistribution 0 – 10% + 20,309 + 21,236 + 927 10 – 20% + 12,363 + 14,396 + 2,033 20 – 30% + 9,862 + 11,546 + 1,685 30 – 40% + 7,907 + 8,684 + 777 40 – 50% + 6,917 + 7,172 + 255 50 – 60% + 4,921 + 4,717 – 204 60 – 70% +187 – 248 – 435 70 – 80% – 4,862 – 5,426 – 564 80 – 90% – 12,131 – 12,804 – 674 90 – 95% – 18,800 – 19,776 – 976 95 – 99% – 61,681 – 64,852 – 3,172 99 – 100% – 484,493 – 536,697 – 52,204 ALL 0 0 0 Exhibit: Top 20% – 47,594 – 51,450 – 3,856 Top 10% – 83,030 – 90,066 – 7,036 Top 5% – 147,250 – 160,345 – 13,095 Top 1% – 484,493 – 536,697 – 52,204 Main Sources: Tax Foundation Fiscal Incidence Microsimulation Model; CBO final score of health care bill; President's FY 2011 Budget