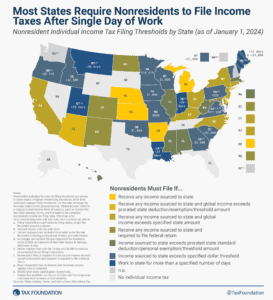
How Burdensome Are Your State’s Nonresident Income Tax Filing Laws?
One relatively easy but meaningful step policymakers can take to make future tax seasons less burdensome is to modernize their state’s nonresident income tax filing, withholding, and reciprocity laws.
7 min read