Download FISCAL FACT No. 414: The High Burden of State and Federal Capital Gains Tax Rates
Savings in an economy is important. It leads to higher levels of investment, a larger capital stock, increased worker productivity and wages, and faster economic growth. However, the United States currently places a heavy taxA tax is a mandatory payment or charge collected by local, state, and national governments from individuals or businesses to cover the costs of general government services, goods, and activities. bias against saving and investment. One way it does this is through a high top marginal tax rateThe marginal tax rate is the amount of additional tax paid for every additional dollar earned as income. The average tax rate is the total tax paid divided by total income earned. A 10 percent marginal tax rate means that 10 cents of every next dollar earned would be taken as tax. on capital gains.
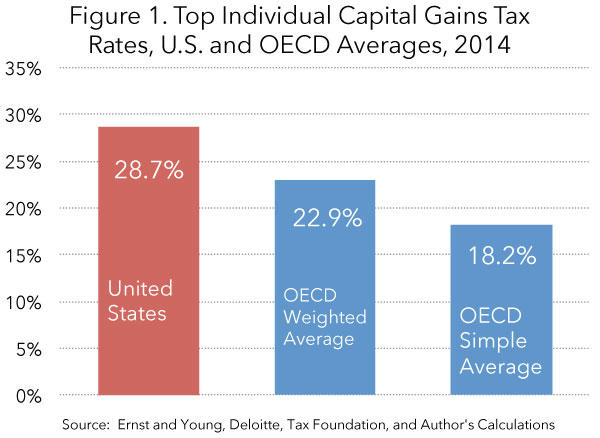
Currently, the United States’ top marginal tax rate on long-term capital gains income is 23.8 percent. In addition, taxpayers face state-level capital gains taxA capital gains tax is levied on the profit made from selling an asset and is often in addition to corporate income taxes, frequently resulting in double taxation. These taxes create a bias against saving, leading to a lower level of national income by encouraging present consumption over investment. rates as low as zero and as high as 13.3 percent. As a result, the average combined top marginal rate in the United States is 28.7 percent. This rate exceeds the average top capital gains tax rate of 18.2 percent faced by taxpayers throughout the industrialized world. Even more, taxpayers in some U.S. states face top rates on capital gains over 30 percent, which is higher than most industrialized countries. In fact, California’s top marginal capital gains tax rate of 33 percent is the third highest in the industrialized world.
Capital Gains Taxes in the United States
The current federal top marginal tax rate on long-term[1] capital gains in the United States is 20 percent plus a 3.8 percent tax on unearned income to fund the Affordable Care Act for a total of 23.8 percent for taxpayers with an adjusted gross incomeFor individuals, gross income is the total pre-tax earnings from wages, tips, investments, interest, and other forms of income and is also referred to as “gross pay.” For businesses, gross income is total revenue minus cost of goods sold and is also known as “gross profit” or “gross margin.” of $200,000 ($250,000 married filing jointly) or more. In addition, states levy taxes on capital gains income,[2] which range from zero percent in states with no individual income taxAn individual income tax (or personal income tax) is levied on the wages, salaries, investments, or other forms of income an individual or household earns. The U.S. imposes a progressive income tax where rates increase with income. The Federal Income Tax was established in 1913 with the ratification of the 16th Amendment. Though barely 100 years old, individual income taxes are the largest source of tax revenue in the U.S. such as Florida, Texas, South Dakota, and Wyoming to 13.3 percent in California. (See Table 1.)[3]
An individual who has capital gains income is subject to both federal and state capital gains rates. Taking into account the state deductibility of federal taxes and the phase-out of itemized deductions,[4] top marginal tax rates on capital gains range from 25 percent[5] in the nine states that do not levy a tax on personal income to 33 percent in California. The average across the United States is 28.7 percent.[6]
How the United States Compares to the OECD
The United States’ average top marginal tax rate on capital gains of 28.7 percent is the 6th highest rate in the OECD and is more than 10 percentage points higher than the simple average of 18 percent across the 34 countries (Table 2).[7] The highest rate on capital gains is 42 percent in Denmark. Nine OECD countries do not tax capital gains.
It is also worth noting that taxpayers in many U.S. states face much higher marginal tax rates on capital gains than taxpayers in most OECD countries (Table 3). Comparing U.S. states with individual countries in the OECD, U.S. states have six of the top ten capital gains tax rates in the OECD. California, with a top rate of 33 percent, has the third-highest capital gains tax rate in the industrialized world, while even taxpayers in states without taxes on capital gains, such as Florida, Texas, South Dakota, and Wyoming, face top rates higher than the OECD average.
The Impact of a High Tax Burden on Capital Gains
The United States’ high tax burden on capital gains has long-term negative implications for the economy. This non-neutral tax creates a bias against savings, slows economic growth, and harms U.S.’s competitiveness.
Capital Gains Tax is One of Many Taxes on the Same Dollar
Capital gains taxes represent an additional tax on a dollar of income that has already been taxed multiple times. For example, take an individual who earns a wage and decides to save by purchasing stock. First, when he earns his wage, it is taxed once by the federal and state individual income tax. He then purchases stock and lets his investment grow. However, that growth is smaller than it otherwise would have been due to the corporate income taxA corporate income tax (CIT) is levied by federal and state governments on business profits. Many companies are not subject to the CIT because they are taxed as pass-through businesses, with income reportable under the individual income tax. on the profits of the corporation in which he invested.[8] After ten years, he decides to sell the stock and realize his capital gains. At this point, the gains (the difference between the value of the stock at purchase and the value at sale) are taxed once more by the capital gains tax. Even more, the effective capital gains tax rate could be even higher on your gains due to the fact that a significant difference in the value of the stock is due to inflationInflation is when the general price of goods and services increases across the economy, reducing the purchasing power of a currency and the value of certain assets. The same paycheck covers less goods, services, and bills. It is sometimes referred to as a “hidden tax,” as it leaves taxpayers less well-off due to higher costs and “bracket creep,” while increasing the government’s spending power. and not real gains.[9]
Creates a Bias Against Saving
These multiple layers of taxation encourage present consumption over savings. Suppose someone makes $1,000 and it is first taxed at 20 percent through the income tax. This person now has a choice. He can either spend it all today or save it in stocks or bonds and spend it later. If he spends it today and buys a television, he would pay a state or local sales taxA sales tax is levied on retail sales of goods and services and, ideally, should apply to all final consumption with few exemptions. Many governments exempt goods like groceries; base broadening, such as including groceries, could keep rates lower. A sales tax should exempt business-to-business transactions which, when taxed, cause tax pyramiding. . However, if he decides to save it, delaying consumption, he is subject to the multiple layers of taxation discussed previously plus the sales tax when he eventually purchases the television. This lowers the potential rate of return on an investment, which discourages the savings. As an individual, to avoid the multiple layers of taxation on the same dollar, it makes more sense to spend it all now rather than spend it later and pay multiple taxes.
Slows Economic Growth
As people prefer consumption today due to the tax bias against savings, there will be less available capital in the future. For investors, this represents less available capital for factories, machines, and other investment opportunities. Additionally, capital gains taxes create a lock-in effect that reduces the mobility of capital.[10] People are less willing to realize capital gains from one investment in order to move to another when they face a tax on their returns. Funds will be slower to move to better investments, further slowing economic growth.
Harms U.S. Competitiveness, Raises the Cost of Capital
Relatively high capital gains taxes also harm the competitiveness of U.S. corporations by raising the cost of capital. As corporations seek higher returns, corporate investment will move to countries that have lower capital gains tax rates.[11] Following the reduction of capital gains tax rates in the U.S. in 1978 from 39 percent to 20 percent, the ability of firms to raise funds through equity offerings greatly increased. As a result, the daily volume of the New York Stock Exchange increased from 28.6 million shares to 85 million shares in five years.[12] Higher rates also slows down the productivity of workers due to less investment in new machinery and software.
Conclusion
The United States currently places a heavy tax burden on saving and investment with its capital gains tax. Its top marginal tax rate on capital gains, combined with state rates, far exceeds rates faced throughout the industrialized world. Increasing taxes on capital income would further the bias against savings, lead to lower levels investment, and slower economic growth. Lowering taxes on capital would the reverse effect, increasing investment and leading the greater economic growth.
|
Table 1. Top Marginal Tax Rate on Capital Gains, by U.S. States, 2014 |
||||
|
Rank |
State |
State Rate |
Combined Rate |
|
|
1 |
California |
13.3% |
33.0% |
|
|
2 |
New York* |
8.8% |
31.5% |
|
|
3 |
Oregon |
9.9% |
31.0% |
|
|
4 |
Minnesota |
9.9% |
30.9% |
|
|
5 |
New Jersey |
9.0% |
30.4% |
|
|
5 |
Vermont |
9.0% |
30.4% |
|
|
7 |
Maryland* |
5.8% |
30.3% |
|
|
8 |
Maine |
8.0% |
29.8% |
|
|
9 |
Iowa* |
9.0% |
29.6% |
|
|
10 |
Idaho |
7.4% |
29.4% |
|
|
10 |
Hawaii* |
7.3% |
29.4% |
|
|
12 |
Nebraska |
6.8% |
29.1% |
|
|
13 |
Connecticut |
6.7% |
29.0% |
|
|
13 |
Delaware |
6.6% |
29.0% |
|
|
15 |
West Virginia |
6.5% |
28.9% |
|
|
16 |
Georgia |
6.0% |
28.6% |
|
|
16 |
Kentucky |
6.0% |
28.6% |
|
|
16 |
Missouri |
6.0% |
28.6% |
|
|
16 |
Rhode Island |
6.0% |
28.6% |
|
|
20 |
North Carolina |
5.8% |
28.5% |
|
|
20 |
Virginia |
5.8% |
28.5% |
|
|
22 |
Ohio* |
5.4% |
28.3% |
|
|
23 |
Wisconsin* |
7.7% |
28.2% |
|
|
23 |
Oklahoma |
5.3% |
28.2% |
|
|
25 |
Massachusetts |
5.2% |
28.1% |
|
|
26 |
Illinois |
5.0% |
28.0% |
|
|
26 |
Mississippi |
5.0% |
28.0% |
|
|
26 |
Utah |
5.0% |
28.0% |
|
|
29 |
Arkansas* |
7.0% |
27.9% |
|
|
29 |
Montana* |
6.9% |
27.9% |
|
|
29 |
Louisiana* |
6.0% |
27.9% |
|
|
29 |
Kansas |
4.8% |
27.9% |
|
|
33 |
Indiana* |
3.4% |
27.8% |
|
|
33 |
Michigan* |
4.4% |
27.8% |
|
|
33 |
Colorado |
4.6% |
27.8% |
|
|
36 |
Arizona |
4.5% |
27.7% |
|
|
37 |
Alabama* |
5.0% |
27.4% |
|
|
38 |
South Carolina* |
7.0% |
27.3% |
|
|
39 |
Pennsylvania |
3.1% |
26.8% |
|
|
40 |
New Mexico* |
4.9% |
26.5% |
|
|
41 |
North Dakota* |
3.2% |
26.3% |
|
|
42 |
Tennessee |
0.0% |
25.0% |
|
|
42 |
New Hampshire |
0.0% |
25.0% |
|
|
42 |
Alaska |
0.0% |
25.0% |
|
|
42 |
Florida |
0.0% |
25.0% |
|
|
42 |
Nevada |
0.0% |
25.0% |
|
|
42 |
South Dakota |
0.0% |
25.0% |
|
|
42 |
Texas |
0.0% |
25.0% |
|
|
42 |
Washington |
0.0% |
25.0% |
|
|
42 |
Wyoming |
0.0% |
25.0% |
|
|
D.C. |
9.0% |
30.4% |
||
|
U.S. Average |
28.7% |
|||
|
Source: Tax Foundation, Commerce Clearing House, and author's calculations |
||||
|
*These states either allow a taxpayer to deduct their federal taxes from state taxable income, have local income taxes, or have special tax treatment of capital gains income. |
||||
|
Table 2. Top Marginal Tax Rate on Capital Gains, by OECD Nation, 2014 |
|||
|
Rank |
Country |
Rate |
|
|
1 |
Denmark |
42.0% |
|
|
2 |
France |
38.0% |
|
|
3 |
Ireland |
33.0% |
|
|
4 |
Finland |
32.0% |
|
|
5 |
Sweden |
30.0% |
|
|
6 |
United States |
28.7% |
|
|
7 |
Portugal |
28.0% |
|
|
7 |
United Kingdom |
28.0% |
|
|
9 |
Norway |
27.0% |
|
|
9 |
Spain |
27.0% |
|
|
11 |
Austria |
25.0% |
|
|
11 |
Germany |
25.0% |
|
|
11 |
Israel |
25.0% |
|
|
11 |
Slovak Republic |
25.0% |
|
|
15 |
Australia |
22.5% |
|
|
15 |
Canada |
22.5% |
|
|
17 |
Estonia |
21.0% |
|
|
18 |
Chile |
20.0% |
|
|
18 |
Iceland |
20.0% |
|
|
18 |
Italy |
20.0% |
|
|
18 |
Japan |
20.0% |
|
|
22 |
Poland |
19.0% |
|
|
23 |
Hungary |
16.0% |
|
|
24 |
Greece |
15.0% |
|
|
25 |
Mexico |
10.0% |
|
|
26 |
Belgium |
0.0% |
|
|
26 |
Czech Republic |
0.0% |
|
|
26 |
Korea |
0.0% |
|
|
26 |
Luxembourg |
0.0% |
|
|
26 |
Netherlands |
0.0% |
|
|
26 |
New Zealand |
0.0% |
|
|
26 |
Slovenia |
0.0% |
|
|
26 |
Switzerland |
0.0% |
|
|
26 |
Turkey |
0.0% |
|
|
OECD Simple Average |
18.2% |
||
|
OECD Weighted Average |
22.9% |
||
|
Source: Ernst & Young, Deloitte |
|||
|
Table 3. Top Marginal Tax Rate on Capital Gains, by OECD Nation and U.S. State, 2014 |
|||
|
Rank |
State/Country |
Rate |
|
|
1 |
Denmark |
42.0% |
|
|
2 |
France |
38.0% |
|
|
3 |
California |
33.0% |
|
|
3 |
Ireland |
33.0% |
|
|
5 |
Finland |
32.0% |
|
|
6 |
New York |
31.5% |
|
|
7 |
Oregon |
31.0% |
|
|
8 |
Minnesota |
30.9% |
|
|
9 |
New Jersey |
30.4% |
|
|
9 |
Vermont |
30.4% |
|
|
9 |
D.C. |
30.4% |
|
|
12 |
Maryland |
30.3% |
|
|
13 |
Sweden |
30.0% |
|
|
14 |
Maine |
29.8% |
|
|
15 |
Iowa |
29.6% |
|
|
16 |
Idaho |
29.4% |
|
|
16 |
Hawaii |
29.4% |
|
|
18 |
Nebraska |
29.1% |
|
|
19 |
Connecticut |
29.0% |
|
|
19 |
Delaware |
29.0% |
|
|
21 |
West Virginia |
28.9% |
|
|
22 |
United States |
28.7% |
|
|
23 |
Georgia |
28.6% |
|
|
23 |
Kentucky |
28.6% |
|
|
23 |
Missouri |
28.6% |
|
|
23 |
Rhode Island |
28.6% |
|
|
27 |
North Carolina |
28.5% |
|
|
27 |
Virginia |
28.5% |
|
|
29 |
Ohio |
28.3% |
|
|
30 |
Wisconsin |
28.2% |
|
|
30 |
Oklahoma |
28.2% |
|
|
32 |
Massachusetts |
28.1% |
|
|
33 |
Portugal |
28.0% |
|
|
33 |
United Kingdom |
28.0% |
|
|
33 |
Illinois |
28.0% |
|
|
33 |
Mississippi |
28.0% |
|
|
33 |
Utah |
28.0% |
|
|
38 |
Arkansas |
27.9% |
|
|
38 |
Montana |
27.9% |
|
|
38 |
Louisiana |
27.9% |
|
|
38 |
Kansas |
27.9% |
|
|
42 |
Indiana |
27.8% |
|
|
42 |
Michigan |
27.8% |
|
|
42 |
Colorado |
27.8% |
|
|
45 |
Arizona |
27.7% |
|
|
46 |
Alabama |
27.4% |
|
|
47 |
South Carolina |
27.3% |
|
|
48 |
Norway |
27.0% |
|
|
48 |
Spain |
27.0% |
|
|
50 |
Pennsylvania |
26.8% |
|
|
51 |
New Mexico |
26.5% |
|
|
52 |
North Dakota |
26.3% |
|
|
53 |
Tennessee |
25.0% |
|
|
53 |
New Hampshire |
25.0% |
|
|
53 |
Austria |
25.0% |
|
|
53 |
Germany |
25.0% |
|
|
53 |
Israel |
25.0% |
|
|
53 |
Slovak Republic |
25.0% |
|
|
53 |
Alaska |
25.0% |
|
|
53 |
Florida |
25.0% |
|
|
53 |
Nevada |
25.0% |
|
|
53 |
South Dakota |
25.0% |
|
|
53 |
Texas |
25.0% |
|
|
53 |
Washington |
25.0% |
|
|
53 |
Wyoming |
25.0% |
|
|
66 |
Australia |
22.5% |
|
|
66 |
Canada |
22.5% |
|
|
68 |
Estonia |
21.0% |
|
|
69 |
Chile |
20.0% |
|
|
69 |
Iceland |
20.0% |
|
|
69 |
Italy |
20.0% |
|
|
69 |
Japan |
20.0% |
|
|
73 |
Poland |
19.0% |
|
|
74 |
Hungary |
16.0% |
|
|
75 |
Greece |
15.0% |
|
|
76 |
Mexico |
10.0% |
|
|
77 |
Belgium |
0.0% |
|
|
77 |
Czech Republic |
0.0% |
|
|
77 |
Korea |
0.0% |
|
|
77 |
Luxembourg |
0.0% |
|
|
77 |
Netherlands |
0.0% |
|
|
77 |
New Zealand |
0.0% |
|
|
77 |
Slovenia |
0.0% |
|
|
77 |
Switzerland |
0.0% |
|
|
77 |
Turkey |
0.0% |
|
|
OECD Simple Average |
18.2% |
||
|
Source: Ernst and Young, Deloitte, Tax Foundation, and author's calculations |
|||
[1] Assets held for more than one year.
[2] Most states tax capital gains as ordinary income.
[3] Tax Foundation, Facts & Figures 2014: How Does Your State Compare? (forthcoming). See also Commerce Clearing House Intelliconnect database.
[4] The Pease limitation on itemized deductionItemized deductions allow individuals to subtract designated expenses from their taxable income and can be claimed in lieu of the standard deduction. Itemized deductions include those for state and local taxes, charitable contributions, and mortgage interest. An estimated 13.7 percent of filers itemized in 2019, most being high-income taxpayers. s reduces many deductions by 3 percent for taxpayers with adjusted gross income exceeding $250,000 ($300,000 married filing jointly).
[5] Assuming individuals facing the top marginal rate have itemized deductions against which the Pease limitation is applied.
[6] The U.S. average is the combined federal, state, and local rates on capital gains, taking into account the Pease limitation and state/federal deductibility of income taxes weighted by capital gains income in each state. For capital gains income data, see Internal Revenue Service, Statistics of Income, Historic Table 2, http://www.irs.gov/uac/SOI-Tax-Stats—Historic-Table-2.
[7] Ernst & Young, 2013-2014 The worldwide personal tax guide, http://www.ey.com/GL/en/Services/Tax/The-worldwide-personal-tax-guide—Country-list. See also Deloitte, Deloitte International Tax Source, Country Guides and Highlights, https://www.dits.deloitte.com/Administration/ManageHomePage/Popup.aspx?ChildPage=Country%20Guides%20and%20Highlights.
[8] For an explanation of “integrated tax rates on capital gains,” see Ernst & Young LLP, Robert Carroll & Gerald Prante, Corporate Dividend and Capital Gains Taxation: A comparison of the United States to other developed nations (Feb. 2012), http://images.politico.com/global/2012/02/120208_asidividend.html.
[9] John L. Aldridge & Kyle Pomerleau, Inflation Can Cause an Infinite Effective Tax Rate on Capital Gains, Tax Foundation Fiscal Fact No. 406 (Dec. 17, 2013), https://taxfoundation.org/article/inflation-can-cause-infinite-effective-tax-rate-capital-gains.
[10] Bruce Bartlett, The Case for Ending the Capital Gains Tax, 41 Financial Analysts Journal 22-30 (June-July 1985).
[11] Chris Edwards, Advantages of Low Capital Gains Tax Rates, Cato Institute Tax & Budget Bulletin No. 66 (Dec. 27, 2012), http://www.cato.org/publications/tax-budget-bulletin/advantages-low-capital-gains-tax-rates.
[12] See Bartlett, supra note 10.