State and local governments across the country split $150 billion in federal aid under a provision of the Coronavirus Aid, Relief and Economic Security (CARES) Act, passed on March 30th. The division of these dollars, made available through the new Coronavirus Relief Fund, has generated significant confusion. Here, we explain how the money is allocated, and provide a table showing the amount available for each state and eligible county across the country.
Allocation is by population, except that $3 billion is reserved for U.S. territories and the District of Columbia, $8 billion is set aside for tribal governments, and each state is guaranteed at least $1.25 billion even if its population share would otherwise indicate a lesser amount.
Local governments with populations of 500,000 or more are also eligible for aid, a provision responsible for much of the confusion. Localities are permitted to claim 45 percent of the amount allocated for their population, while the state retains the other 55 percent as it also serves that population. The state also retains 100 percent of the amount allocated to populations not within a locality of 500,000 or more.
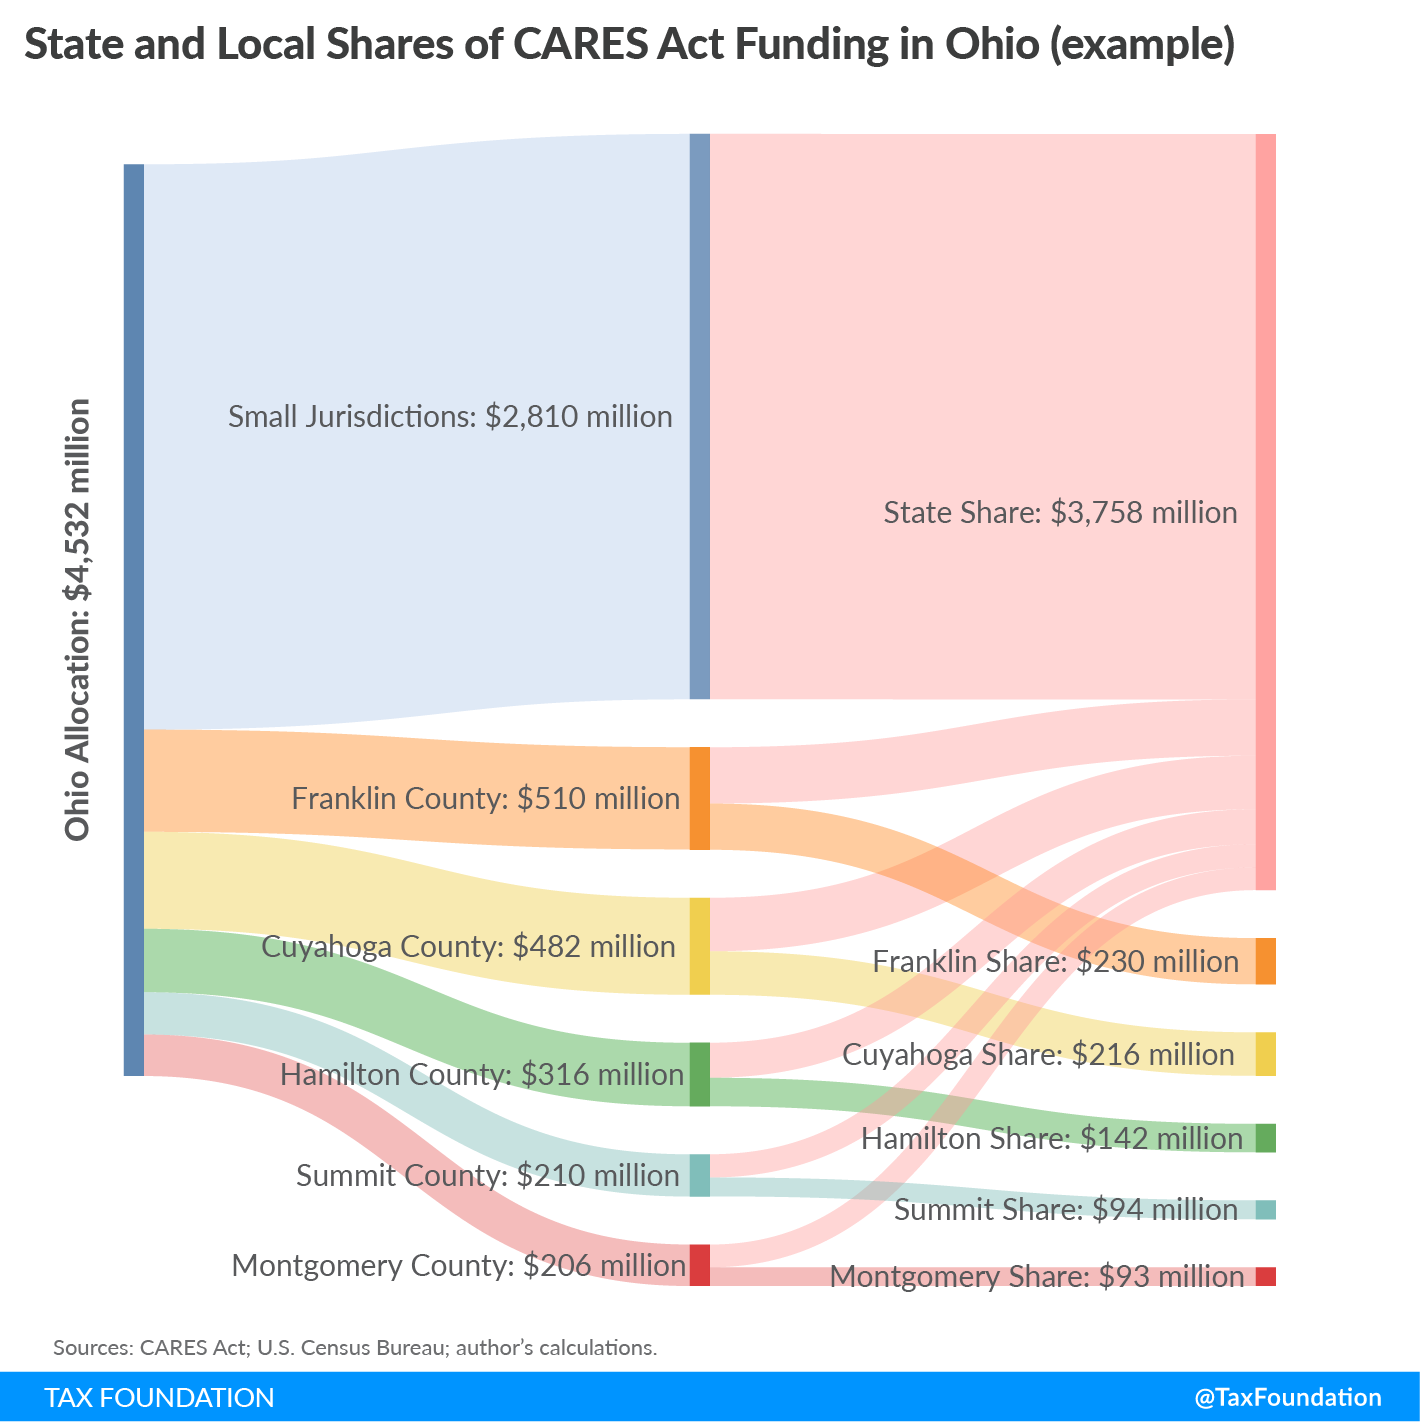
To see how this works, consider the example of Ohio:
- Total state and local share under the CARES Act: $4.53 billion
- State population: 11.69 million
- 4.44 million people live within the 5 eligible counties of 500,000+ people
- $1.72 billion is associated with that share of the population
- These counties can claim 45 percent, or $775 million, of this total
- The state retains the remaining 55 percent associated with this population ($946 million)
- 7.25 million residents live outside an eligible locality
- $2.81 billion is associated with this share of the population
- That entire amount goes to state government
- In total, the state government is eligible for about $3.76 billion and local governments get $775 million
The diagram below illustrates this concept. Note how state and eligible local governments split the funding associated with their populations, while the state retains all money associated with the share of the state’s population that lives outside an eligible jurisdiction.
Notably, the language of the CARES Act mentions counties, cities, and other local governing bodies—and, with a few exceptions, cities are situated within counties, meaning that in many cases there are overlapping eligible populations. The city of Columbus, Ohio, for instance, is the county seat of Franklin County, and both have populations in excess of 500,000.
It is not clear how the U.S. Treasury Department will handle such overlapping populations. One plausible interpretation is that the city can claim the share associated with its population and the county may claim the share associated with county residents outside the city. Treasury could also allow these jurisdictions to share the revenue in other ways. What is reasonably clear, however, is that they may not double up: Franklin County and all its subdivisions are entitled to a total of $230 million, however it may be divided between the city and county.
The following table shows how much is allocated to each state overall (state and local government combined), plus how that aid is broken out—the state share and the share for each eligible county or county equivalent (including independent cities). As with the example above, in some cases, cities within these counties may share in the amount indicated for the county.
This table uses the latest available population data, circa July 2019. It is possible that the Treasury Department will use different figures. The greatest possible effect of using a different population dataset would be the inclusion or exclusion of jurisdictions just on the cusp of the 500,000-person threshold. As of July 2019, for instance, Sonoma County, California had a population of 494,336, and Morris County, New Jersey had a population of 491,845. If either of these counties, or others that are in similar positions, were to exceed the 500,000 threshold under the count employed by the Treasury Department, local distributions would diverge slightly from the amounts indicated below.
| State | Jurisdiction | Amount |
|---|---|---|
| Alabama | Total Allocation | $1,901,376,504 |
| State Share | $1,786,453,683 | |
| Jefferson County | $114,922,821 | |
| Alaska | Total Allocation | $1,250,000,000 |
| State Share | $1,250,000,000 | |
| Arizona | Total Allocation | $2,822,569,714 |
| State Share | $1,857,099,389 | |
| Maricopa County | $782,717,225 | |
| Pima County | $182,753,100 | |
| Arkansas | Total Allocation | $1,250,000,000 |
| State Share | $1,250,000,000 | |
| California | Total Allocation | $15,322,206,367 |
| State Share | $9,526,137,621 | |
| Alameda County | $291,651,561 | |
| Contra Costa County | $201,293,497 | |
| Fresno County | $174,345,905 | |
| Kern County | $157,087,754 | |
| Los Angeles County | $1,751,852,108 | |
| Orange County | $554,167,091 | |
| Riverside County | $431,117,152 | |
| Sacramento County | $270,838,440 | |
| San Bernardino County | $380,430,899 | |
| San Diego County | $582,547,875 | |
| San Francisco County | $153,832,754 | |
| San Joaquin County | $132,996,947 | |
| San Mateo County | $133,769,122 | |
| Santa Clara County | $336,415,539 | |
| Stanislaus County | $96,091,702 | |
| Ventura County | $147,630,401 | |
| Colorado | Total Allocation | $2,233,145,460 |
| State Share | $1,673,950,246 | |
| Adams County | $90,291,404 | |
| Arapahoe County | $114,576,782 | |
| Denver County | $126,900,343 | |
| El Paso County | $125,712,328 | |
| Jefferson County | $101,714,356 | |
| Connecticut | Total Allocation | $1,382,561,117 |
| State Share | $913,181,962 | |
| Fairfield County | $164,614,059 | |
| Hartford County | $155,607,621 | |
| New Haven County | $149,157,475 | |
| Delaware | Total Allocation | $1,250,000,000 |
| State Share | $927,233,331 | |
| New Castle County | $322,766,669 | |
| Florida | Total Allocation | $8,328,721,940 |
| State Share | $5,856,159,554 | |
| Brevard County | $105,040,554 | |
| Broward County | $340,765,195 | |
| Duval County | $167,130,913 | |
| Hillsborough County | $256,862,512 | |
| Lee County | $134,467,831 | |
| Miami-Dade County | $474,113,590 | |
| Orange County | $243,161,252 | |
| Palm Beach County | $261,190,530 | |
| Pasco County | $96,665,293 | |
| Pinellas County | $170,139,515 | |
| Polk County | $126,475,603 | |
| Volusia County | $96,549,598 | |
| Georgia | Total Allocation | $4,117,266,353 |
| State Share | $3,503,081,996 | |
| Cobb County | $132,646,720 | |
| DeKalb County | $132,499,439 | |
| Fulton County | $185,659,967 | |
| Gwinnett County | $163,378,230 | |
| Hawaii | Total Allocation | $1,250,000,000 |
| State Share | $862,823,979 | |
| Honolulu County | $387,176,021 | |
| Idaho | Total Allocation | $1,250,000,000 |
| State Share | $1,250,000,000 | |
| Illinois | Total Allocation | $4,913,928,948 |
| State Share | $3,519,156,999 | |
| Cook County | $898,729,990 | |
| DuPage County | $161,052,283 | |
| Kane County | $92,905,805 | |
| Lake County | $121,547,296 | |
| Will County | $120,536,576 | |
| Indiana | Total Allocation | $2,610,646,554 |
| State Share | $2,442,324,311 | |
| Marion County | $168,322,243 | |
| Iowa | Total Allocation | $1,250,000,000 |
| State Share | $1,250,000,000 | |
| Kansas | Total Allocation | $1,250,000,000 |
| State Share | $1,034,052,049 | |
| Johnson County | $116,311,034 | |
| Sedgwick County | $99,636,917 | |
| Kentucky | Total Allocation | $1,732,491,935 |
| State Share | $1,598,690,705 | |
| Jefferson County | $133,801,230 | |
| Louisiana | Total Allocation | $1,802,727,754 |
| State Share | $1,802,727,754 | |
| Maine | Total Allocation | $1,250,000,000 |
| State Share | $1,250,000,000 | |
| Maryland | Total Allocation | $2,344,417,741 |
| State Share | $1,653,367,701 | |
| Anne Arundel County | $101,077,945 | |
| Baltimore city | $103,565,657 | |
| Baltimore County | $144,378,367 | |
| Montgomery County | $183,347,980 | |
| Prince George’s County | $158,680,092 | |
| Massachusetts | Total Allocation | $2,672,802,119 |
| State Share | $1,655,720,328 | |
| Bristol County | $98,631,939 | |
| Essex County | $137,688,629 | |
| Middlesex County | $281,245,960 | |
| Norfolk County | $123,334,204 | |
| Plymouth County | $90,951,199 | |
| Suffolk County | $140,284,009 | |
| Worcester County | $144,945,850 | |
| Michigan | Total Allocation | $3,872,742,971 |
| State Share | $3,080,874,821 | |
| Kent County | $114,640,476 | |
| Macomb County | $152,510,546 | |
| Oakland County | $219,451,908 | |
| Wayne County | $305,265,221 | |
| Minnesota | Total Allocation | $2,186,958,839 |
| State Share | $1,870,033,167 | |
| Hennepin County | $220,893,126 | |
| Ramsey County | $96,032,546 | |
| Mississippi | Total Allocation | $1,250,000,000 |
| State Share | $1,250,000,000 | |
| Missouri | Total Allocation | $2,379,996,144 |
| State Share | $2,083,827,229 | |
| Jackson County | $122,677,376 | |
| St. Louis County | $173,491,539 | |
| Montana | Total Allocation | $1,250,000,000 |
| State Share | $1,250,000,000 | |
| Nebraska | Total Allocation | $1,250,000,000 |
| State Share | $1,083,865,742 | |
| Douglas County | $166,134,258 | |
| Nevada | Total Allocation | $1,250,000,000 |
| State Share | $836,051,100 | |
| Clark County | $413,948,900 | |
| New Hampshire | Total Allocation | $1,250,000,000 |
| State Share | $1,250,000,000 | |
| New Jersey | Total Allocation | $3,444,370,826 |
| State Share | $2,393,995,126 | |
| Bergen County | $162,671,843 | |
| Camden County | $88,380,599 | |
| Essex County | $139,423,361 | |
| Hudson County | $117,334,101 | |
| Middlesex County | $143,975,615 | |
| Monmouth County | $107,981,449 | |
| Ocean County | $105,955,647 | |
| Passaic County | $87,570,033 | |
| Union County | $97,083,053 | |
| New Mexico | Total Allocation | $1,250,000,000 |
| State Share | $1,067,817,494 | |
| Bernalillo County | $182,182,506 | |
| New York | Total Allocation | $7,543,778,952 |
| State Share | $5,219,021,994 | |
| Bronx County | $247,481,068 | |
| Erie County | $160,316,055 | |
| Kings County | $446,710,197 | |
| Monroe County | $129,440,929 | |
| Nassau County | $236,787,014 | |
| New York County | $284,213,729 | |
| Queens County | $393,304,493 | |
| Suffolk County | $257,670,983 | |
| Westchester County | $168,832,489 | |
| North Carolina | Total Allocation | $4,067,110,763 |
| State Share | $3,585,606,805 | |
| Guilford County | $93,738,358 | |
| Mecklenburg County | $193,760,212 | |
| Wake County | $194,005,388 | |
| North Dakota | Total Allocation | $1,250,000,000 |
| State Share | $1,250,000,000 | |
| Ohio | Total Allocation | $4,532,845,506 |
| State Share | $3,757,703,970 | |
| Cuyahoga County | $215,523,501 | |
| Franklin County | $229,777,586 | |
| Hamilton County | $142,651,313 | |
| Montgomery County | $92,780,861 | |
| Summit County | $94,408,274 | |
| Oklahoma | Total Allocation | $1,534,449,890 |
| State Share | $1,281,597,801 | |
| Oklahoma County | $139,154,452 | |
| Tulsa County | $113,697,637 | |
| Oregon | Total Allocation | $1,635,570,763 |
| State Share | $1,388,745,825 | |
| Multnomah County | $141,845,459 | |
| Washington County | $104,979,478 | |
| Pennsylvania | Total Allocation | $4,964,406,011 |
| State Share | $3,935,406,029 | |
| Allegheny County | $212,203,236 | |
| Bucks County | $109,634,863 | |
| Chester County | $91,612,041 | |
| Delaware County | $98,898,929 | |
| Lancaster County | $95,230,357 | |
| Montgomery County | $144,996,980 | |
| Philadelphia County | $276,423,576 | |
| Rhode Island | Total Allocation | $1,250,000,000 |
| State Share | $910,740,118 | |
| Providence County | $339,259,882 | |
| South Carolina | Total Allocation | $1,996,588,712 |
| State Share | $1,905,229,176 | |
| Greenville County | $91,359,536 | |
| South Dakota | Total Allocation | $1,250,000,000 |
| State Share | $1,250,000,000 | |
| Tennessee | Total Allocation | $2,648,244,148 |
| State Share | $2,363,576,014 | |
| Davidson County | $121,130,060 | |
| Shelby County | $163,538,075 | |
| Texas | Total Allocation | $11,244,137,605 |
| State Share | $8,038,804,878 | |
| Bexar County | $349,625,748 | |
| Collin County | $180,563,264 | |
| Dallas County | $459,904,876 | |
| Denton County | $154,820,090 | |
| El Paso County | $146,449,366 | |
| Fort Bend County | $141,641,815 | |
| Harris County | $822,488,328 | |
| Hidalgo County | $151,591,789 | |
| Montgomery County | $105,991,420 | |
| Tarrant County | $366,894,718 | |
| Travis County | $222,308,518 | |
| Williamson County | $103,052,793 | |
| Utah | Total Allocation | $1,250,000,000 |
| State Share | $936,475,736 | |
| Salt Lake County | $202,499,486 | |
| Utah County | $111,024,778 | |
| Vermont | Total Allocation | $1,250,000,000 |
| State Share | $1,250,000,000 | |
| Virginia | Total Allocation | $3,309,937,372 |
| State Share | $3,109,689,845 | |
| Fairfax County | $200,247,527 | |
| Washington | Total Allocation | $2,952,933,375 |
| State Share | $2,167,209,642 | |
| King County | $393,116,728 | |
| Pierce County | $157,921,528 | |
| Snohomish County | $143,455,771 | |
| Spokane County | $91,229,706 | |
| West Virginia | Total Allocation | $1,250,000,000 |
| State Share | $1,250,000,000 | |
| Wisconsin | Total Allocation | $2,257,846,523 |
| State Share | $1,997,414,905 | |
| Dane County | $95,399,799 | |
| Milwaukee County | $165,031,819 | |
| Wyoming | Total Allocation | $1,250,000,000 |
| State Share | $1,250,000,000 | |
|
Sources: CARES Act; U.S. Census Bureau; author’s calculations. |
||
Errata: Due to a WordPress glitch with bullet points, this document was originally published omitting the first digit of Ohio’s population figures.
Stay informed on the tax policies impacting you.
Subscribe to get insights from our trusted experts delivered straight to your inbox.
Subscribe